
UNITED STATES
SECURITIES AND EXCHANGE COMMISSION
WASHINGTON, D.C. 20549
FORM 10-K
| x | ANNUAL REPORT PURSUANT TO SECTION 13 OR 15(d) OF THE SECURITIES EXCHANGE ACT OF 1934 |
FOR THE FISCAL YEAR ENDED DECEMBER 31, 2017
OR
| ¨ | TRANSITION REPORT PURSUANT TO SECTION 13 OR 15(d) OF THE SECURITIES EXCHANGE ACT OF 1934 |
COMMISSION FILE NUMBER 000-26497
SALEM MEDIA GROUP, INC.
(EXACT NAME OF REGISTRANT AS SPECIFIED IN ITS CHARTER)
| DELAWARE (STATE OR OTHER JURISDICTION OF INCORPORATION OR ORGANIZATION) |
77-0121400 (I.R.S. EMPLOYER IDENTIFICATION NUMBER) | |
| 4880 SANTA ROSA ROAD CAMARILLO, CALIFORNIA (ADDRESS OF PRINCIPAL EXECUTIVE OFFICES) |
93012 (ZIP CODE) |
REGISTRANT’S TELEPHONE NUMBER, INCLUDING AREA CODE: (805) 987-0400
Securities registered pursuant to Section 12(b) of the Act:
| Title of each class | Name of the Exchange on which registered |
| Class A Common Stock, $0.01 par value per share | The NASDAQ Global Market |
Securities registered pursuant to Section 12(g) of the Act: None
Indicate by check mark if the registrant is a well-known seasoned issuer, as defined in Rule 405 of the Securities Act.
Yes ¨ No x
Indicate by check mark if the registrant is not required to file reports pursuant to Section 13 or Section 15(d) of the Exchange Act.
Yes ¨ No x
Indicate by check mark whether the registrant (1) has filed all reports required to be filed by Section 13 or 15(d) of the Securities Exchange Act of 1934 during the preceding 12 months (or for such shorter period that the registrant was required to file such reports), and (2) has been subject to such filing requirements for the past 90 days.
Yes x No ¨
Indicate by check mark whether the registrant has submitted electronically and posted on its corporate Web site, if any, every Interactive Data File required to be submitted and posted pursuant to Rule 405 of Regulation S-T (§ 232.405 of this chapter) during the preceding 12 months (or for such shorter period that the registrant was required to submit and post such files).
Yes x No ¨
Indicate by check mark if disclosure of delinquent filers pursuant to Item 405 of Regulation S-K is not contained herein, and will not be contained, to the best of registrant's knowledge, in definitive proxy or information statements incorporated by reference in Part III of this Form 10-K or any amendment to this Form 10-K. ¨
Indicate by check mark whether the registrant is a large accelerated filer, an accelerated filer, a non-accelerated filer, or a smaller reporting company. See definition of “large accelerated filer,” “accelerated filer,” and “smaller reporting company” in Rule 12b-2 of the Exchange Act.
| Large accelerated filer ¨ | Accelerated filer x | Non-accelerated filer ¨ | Smaller Reporting Company ¨ |
| (Do not check if Smaller Reporting Company) | |||
Indicate by check mark whether the registrant is a shell company (as defined in Rule 12b-2 of the Exchange Act).
Yes ¨ No x
Indicate by check mark whether the registrant is an emerging growth company as defined in Rule 405 of the Securities Act of 1933 (§230.405 of this chapter) or Rule 12b-2 of the Securities Exchange Act of 1934 (§240.12b-2 of this chapter).
Emerging growth company ¨
As of June 30, 2017, the last business day of the registrant’s most recently completed second fiscal quarter, the aggregate market value of the registrant’s common stock held by non-affiliates of the registrant was $78,674,071 based on the closing sale price as reported on the NASDAQ Global Market.
Indicate the number of shares outstanding of each of the issuer’s classes of common stock, as of the latest practicable date.
| Class A | Outstanding at March 8, 2018 | |
| Common Stock, $0.01 par value per share | 20,615,426 shares | |
| Class B | Outstanding at March 8, 2018 | |
| Common Stock, $0.01 par value per share | 5,553,696 shares |
DOCUMENTS INCORPORATED BY REFERENCE
| Document | Parts Into Which Incorporated | |
| Proxy Statement for the Annual Meeting of Stockholders | Part III, Items 10, 11, 12, 13 and 14 |
TABLE OF CONTENTS
CERTAIN DEFINITIONS
Unless the context requires otherwise, all references in this report to “Salem” or the “company,” including references to Salem by “we” “us” “our” and “its” refer to Salem Media Group, Inc. and our subsidiaries.
All metropolitan statistical area (“MSA”) rank information used in this report, excluding information concerning The Commonwealth of Puerto Rico, is from the Fall 2017 Radio Market Survey Schedule & Population Rankings published by Nielsen Audio (“Nielsen”). According to the Radio Market Survey, the population estimates are based upon the 2010 U.S. Bureau Census estimates updated and projected to January 1, 2018 by Nielsen.
NOTE REGARDING FORWARD-LOOKING STATEMENTS
Salem Media Group, Inc. (“Salem” or the “company,” including references to Salem by “we,” “us” and “our”) makes “forward-looking statements” from time to time in both written reports (including this report) and oral statements, within the meaning of federal and state securities laws. Disclosures that use words such as the company “believes,” “anticipates,” “estimates,” “expects,” “intends,” “will,” “may,” “intends,” “could,” “would,” “should,” “seeks,” “predicts,” or “plans” and similar expressions are intended to identify forward-looking statements, as defined under the Private Securities Litigation Reform Act of 1995.
You should not place undue reliance on these forward-looking statements, which reflect our expectations based upon data available to the company as of the date of this report. Such statements are subject to certain risks and uncertainties that could cause actual results to differ materially from expectations. These risks, as well as other risks and uncertainties, are detailed in Salem’s reports on Forms 10-K, 10-Q and 8-K filed with or furnished to the Securities and Exchange Commission. Except as required by law, the company undertakes no obligation to update or revise any forward-looking statements made in this report. Any such forward-looking statements, whether made in this report or elsewhere, should be considered in context with the various disclosures made by Salem about its business. These projections and other forward-looking statements fall under the safe harbors of Section 27A of the Securities Act of 1933, as amended (the “Securities Act”), and Section 21E of the Securities Exchange Act of 1934, as amended (the “Exchange Act”).
| 2 |
CORPORATE INFORMATION
Salem Media Group, Inc. (“Salem”) is a domestic multimedia company specializing in Christian and conservative content, with media properties comprising radio broadcasting, digital media, and publishing. Effective February 19, 2015, we changed our name from Salem Communications Corporation to Salem Media Group, Inc. Salem was formed in 1986 as a California corporation and was reincorporated in Delaware in 1999. Our content is intended for audiences interested in Christian and family-themed programming and conservative news talk. Our filings with the Securities and Exchange Commission (“SEC”) are available under the Investor Relations section of our website at www.salemmedia.com. Any information found our website is not a part of, or incorporated by reference into, this or any report of Salem filed with, or furnished to the SEC.
SEGMENT INFORMATION
We have three operating segments: (1) Broadcast, (2) Digital Media, and (3) Publishing, which also qualify as reportable segments. Our operating segments reflect how our chief operating decision makers, which we define as a collective group of senior executives, assess the performance of each operating segment and determine the appropriate allocations of resources to each segment. We continually review our operating segment classifications to align with operational changes in our business and may make changes as necessary.
We measure and evaluate our operating segments based on operating income and operating expenses that do not include allocations of costs related to corporate functions, such as accounting and finance, human resources, legal, tax and treasury, which are reported as unallocated corporate expenses in our consolidated statements of operations included in this annual report on Form 10-K. We also exclude costs such as amortization, depreciation, taxes and interest expense.
Business Strategy
We are fundamentally committed to programming and content emphasizing Christian values, conservative family themes and news. Our commitment to these values means that we may choose not to switch to other formats or pursue potentially more profitable business opportunities in response to changes in audience preferences.
Our goal is to produce and deliver compelling content to audiences interested in Christian and family-themed programming and conservative news talk to be considered the market leader for all audiences, programmers and advertisers. Our integrated multimedia platform includes traditional forms of media, such as radio broadcasting, print magazines and book publishing as well as emerging forms of media, such as websites, mobile applications and digital publications. We pursue the ongoing expansion of our media platform as the marketplace evolves while aggressively managing operating costs and cash flows. Expansion opportunities include increasing the strength and reach of our broadcast signals, investing in and building Internet websites, promoting our authors and on-air talent, and increasing the distribution and page views for our print and digital content. Our national presence in each of these mediums provides advertisers and programmers with a powerful and integrated platform to reach audiences throughout the United States without compromising the sense of community involvement and branding that we generate locally with sponsored events and promotions.
Broadcasting
Our foundational business is the ownership and operation of radio stations in large metropolitan markets. Our radio stations carry national and local programming content as well as advertising from national and local customers. We produce and sponsor a number of community events that we believe are important in building our brand identity. We also believe that our active community involvement, including remote broadcasts, client events, concerts and tie-ins to major events, builds station awareness and listener loyalty. We promote our station websites on-air and at community events to direct participants to our websites specifically designed for each of our radio stations. Our audiences can access our library of digital content and online publications from any of our station websites.
To operate our broadcast entities efficiently, we assemble market clusters, or multiple radio stations operating within the same geographic market. Several benefits are achievable when operating market clusters. First, we are able to offer advertisers and programmers access to multiple audiences by providing airtime on each radio station in that market when advantageous. Second, we realize cost and operating efficiencies by consolidating sales, technical and administrative support, promotional functions and other shared overhead costs, such as rent, when possible. Third, the addition of new radio stations into existing markets allows us to leverage our hands-on knowledge of that market to increase our appeal to new audiences and advertisers.
| 3 |
Salem Radio Network® and Salem Media Representatives™
Our broadcasting operation includes our national network of affiliated radio stations. Salem Radio Network® (“SRN”), based in Dallas, Texas, develops, produces and syndicates a broad range of programming specifically targeted to Christian and family-themed talk stations, music stations and News Talk stations. SRN delivers programming via satellite to approximately 3,100 affiliated radio stations throughout the United States, including several of our Salem-owned stations. We also own and operate SRN News Network (“SNN”), Today’s Christian Music (“TCM”) and Singing News Network, which are radio networks that produce and distribute talk, news and music programming to radio stations throughout the United States, including several of our Salem-owned stations.
Salem Media RepresentativesTM (“SMR”) is our national advertising sales firm with offices in nine U.S. cities. SMR specializes in placing national advertising on religious and other format commercial radio stations. SMR sells commercial airtime to national advertisers on our radio stations and through our networks, as well as for independent radio station affiliates.
National companies often prefer to advertise across the United States as an efficient and cost effective way to reach their target audiences. Advertisers can benefit from our national platform under which we offer radio airtime, digital advertisements, and print magazine advertisements that reach audiences throughout the United States. SRN and our radio stations each have relationships with SMR for the sale of available SRN spot advertising. SMR also contracts with individual radio stations to sell airtime to national advertisers desiring to include selected Salem stations in national buys covering multiple markets.
Digital Media
Our digital strategy is to operate a web-based platform designed to provide content for audiences interested in Christian and family-themed content and conservative news and opinion. The Internet continues to change the way in which media is delivered to audiences. Continual advancements with online search engines, social media sites and mobile applications provides consumers with numerous methods to locate specific information and content online. Our editorial staff, including our on-air personalities, provide digital commentaries, programs, text, audio and video content that we believe to be knowledge-based, credible and reliable. Our highly specific digital content provides advertisers a unique and powerful way to reach their targeted audiences.
Publishing
Our publishing strategy mirrors that of our other operating segments−to build and maintain a distribution network targeting audiences interested in Christian and family-themed content as well as conservative news and opinion. Our publishing operating segment includes three businesses: (1) Regnery Publishing is a traditional book publisher that has published dozens of bestselling books by leading conservative, Christian and history authors and personalities, including Ann Coulter, Newt Gingrich, David Limbaugh, Ed Klein, Mark Steyn and Dinesh D’Souza; (2) Salem Author Services is a self-publishing service for authors through Xulon Press, Mill City Press and Bookprinting.com; and (3) Singing News® magazine, previously Salem Publishing™ which produces and distributes a print magazine for readers interested in southern gospel music.
Audience Growth
The continued success of our business is dependent upon our ability to reach a growing audience. We seek growth opportunities through increases in the strength and number of our broadcast signals, increases in the number of page-views on our digital platform, increases in book sales and increases in our subscriber base for digital content and print magazines. To accomplish this, we produce content that we believe is both compelling and of high commercial value based on our market testing and understanding of our audience. We rely on a combination of research, marketing, targeted promotions and live events to create visibility and brand awareness in each of our markets. By maximizing our audience share, we can achieve growth in ratings and page turns that we convert into advertising revenues. To maximize results, we cross-promote our content on each of our media platforms to enhance our brand names and reach our targeted audiences. We believe that the growth of our media platform and audience provides advertisers with effective methods to reach a growing audience.
Technical Improvements
We acquired several FM translators and FM translator construction permits and one radio station during the year ended December 31, 2017. Construction permits provide us the authority to construct new FM translators or make changes in our existing facilities that can increase our audience by providing enhanced coverage and reach in existing AM broadcast markets. FM translators allow our AM stations to be heard on FM. We completed seven digital acquisitions, including websites, domain names, mobile applications and a digital newsletter, to expand our digital media platform. We continue to build or purchase websites that allow our audiences to view our content online or through digital streaming. Our digital content is available on numerous iPhone® and Android applications. Each of our radio stations and several of our websites, have iPhone® and Android applications that can be used to view our content or digital streaming on mobile devices.
| 4 |
Sales Professionals
We have assembled an effective, highly trained sales staff that is responsible for converting our audience share into revenue. We operate a focused, sales-oriented culture that rewards selling efforts through a commission and bonus compensation structure. Our sales professionals are provided with the tools and resources necessary to compete effectively in the marketplace. We sell and market our platforms as stand-alone products or in combination with other offerings. Based on our experience, we tailor our advertising campaigns to provide comprehensive solutions for our customers. Our campaigns may include specific geographic coverage areas, event sponsorships, special promotions, e-mail sponsorships, print advertisements, and digital media elements such as banner advertisements, social media distribution, site retargeting and search engine marketing.
Significant Community Involvement
We expect our public image to reflect the lifestyle and viewpoints of the target demographic groups that we serve. We regularly collaborate with organizations that serve Christian and family-themed audiences as well as sponsor and support events that are important to this group. We believe that our ongoing active involvement and our strong relationships within the Christian community provide us with a unique competitive advantage that significantly improves the marketability of our media platform to advertisers and programmers targeting such communities. Our sponsored events include listener rallies, speaking tours, pastor appreciation events and concerts such as our Celebrate Freedom® Music Festivals and FishfestTM concerts. Local events such as these connect us with our audience and enable us to create an enhanced awareness and name recognition in each of our markets. With this involvement, we can increase the effectiveness of developing and improving our programming, which can contribute to a greater audience share and higher ratings over time.
Corporate Structure
Management of our operations is largely decentralized with operational vice presidents and general managers located throughout the United States. We believe that this decentralization encourages each general manager and vice president to apply innovative techniques for improving and growing their operations locally in ways that may be transferable to benefit other markets and operations.
Our broadcast operations vice presidents, some of whom are also station general managers, are experienced radio broadcasters with expertise in sales, programming, marketing and production. Each of our broadcast operations vice presidents oversees several markets on a regional basis. Our digital and publishing operations vice presidents and general managers are also located throughout the United States in locations in which each of our entities operates.
All of our operations receive executive leadership and oversight from our corporate staff. Corporate staff members have experience and expertise in, among other things, accounting and finance, treasury, risk management, insurance, information technology, human resources, legal, engineering, real estate, strategic direction and other support functions designed to provide resources to local management. Corporate staff also oversee the placement and rate negotiations for national block programming on our stations. Centralized oversight of national programming is necessary because several of our key programming partners purchase times in multiple radio markets.
Recent Events
During the year ended December 31, 2017, we completed or entered into the following transactions:
Debt
On May 19, 2017, we closed on a private offering of $255.0 million aggregate principal amount of 6.75% senior secured notes due 2024 (the “Notes”) and concurrently entered into a five-year $30.0 million senior secured asset-based revolving credit facility, which includes a $5.0 million subfacility for standby letters of credit and a $7.5 million subfacility for swingline loans (“ABL Facility”) due May 19, 2022. The net proceeds from the offering of the Notes, together with borrowings under the ABL Facility, were used to repay outstanding borrowings, including accrued and unpaid interest, on our previously existing senior credit facilities consisting of a term loan (“Term Loan B”) and a revolving credit facility of $25.0 million (“Revolver”), and to pay fees and expenses incurred in connection with the Notes offering and the ABL Facility (collectively, the “Refinancing”).
In connection with the Refinancing, on May 19, 2017, we repaid $258.0 million in principal on the Term Loan B and paid interest due as of that date. We recorded a $0.6 million pre-tax loss on the early retirement of long-term debt related to the unamortized discount and a $1.5 million pre-tax loss on the early retirement of long-term debt related to unamortized debt issuance costs associated with the Term Loan B. We also terminated the Revolver as of May 19, 2017. We repaid $4.1 million in outstanding principal on the Revolver and paid interest due as of that date. We recorded a $56,000 pre-tax loss on the early retirement of long-term debt related to unamortized debt issuance costs associated with the Revolver.
| 5 |
On February 28, 2017, we repaid $3.0 million principal on the Term Loan B of $300.0 million, and paid interest due as of that date. We recorded a $6,200 pre-tax loss on the early retirement of long-term debt related to the unamortized discount and $18,000 in unamortized debt issuance costs associated with the principal repayment.
On January 30, 2017, we repaid $2.0 million in principal on the Term Loan B and paid interest due as of that date. We recorded a $4,500 pre-tax loss on the early retirement of long-term debt related to the unamortized discount and $12,000 in unamortized debt issuance costs associated with the principal repayment.
Equity
On December 7, 2017, we announced a quarterly equity distribution in the amount of $0.0650 per share on Class A and Class B common stock. The equity distribution of $1.7 million was paid on December 29, 2017 to all Class A and Class B common stockholders of record as of December 18, 2017.
On September 12, 2017, we announced a quarterly equity distribution in the amount of $0.0650 per share on Class A and Class B common stock. The equity distribution of $1.7 million was paid on September 29, 2017 to all Class A and Class B common stockholders of record as of September 22, 2017.
On August 9, 2017, a restricted stock award of 33,066 shares was granted to an executive that vested immediately. The fair value of the restricted stock award was measured based on the grant date market price of our common shares and expensed as of the vesting date. The restricted stock award contained transfer restrictions under which they could not be sold, pledged, transferred or assigned until 90 days from the vesting date. The recipient of this restricted stock award is entitled to all of the rights of absolute ownership of the restricted stock from the date of grant, including the right to vote the shares and to receive dividends. Restricted stock awards are independent of option grants and are granted at no cost to the recipient other than applicable taxes owed by the recipient. The award was considered issued and outstanding from the vest date of grant.
On June 1, 2017, we announced a quarterly equity distribution in the amount of $0.0650 per share on Class A and Class B common stock. The equity distribution of $1.7 million was paid on June 30, 2017 to all Class A and Class B common stockholders of record as of June 16, 2017.
On March 9, 2017, we announced a quarterly equity distribution in the amount of $0.0650 per share on Class A and Class B common stock. The equity distribution of $1.7 million was paid on March 31, 2017 to all Class A and Class B common stockholders of record as of March 20, 2017.
On February 24, 2017, a restricted stock award of a total of 178,592 shares was granted to certain members of management that vested immediately. The fair value of each restricted stock award was measured based on the grant date market price of our common shares and expensed as of the vesting date. These restricted stock awards contained transfer restrictions under which they could not be sold, pledged, transferred or assigned until three months from the vesting date. Recipients of these restricted stock awards were entitled to all the rights of absolute ownership of the restricted stock from the date of grant, including the right to vote the shares and to receive dividends. Restricted stock awards are independent of option grants and are granted at no cost to the recipient other than applicable taxes owed by the recipient. The awards were considered issued and outstanding from the vest date of grant.
Acquisitions – Broadcast
On November 22, 2017, we closed on the acquisition of radio station WSPZ-AM (now WWRC-AM) in Bethesda, Maryland for $0.6 million in cash from a related party.
On September 15, 2017, we closed on the acquisition of real property, including the land, tower and broadcasting facilities, of radio station WSPZ-AM (now WWRC-AM) in Bethesda, Maryland for $1.5 million in cash.
On July 24, 2017, we closed on the acquisition of the FM translator construction permit in Eaglemount, Washington, for $40,000 in cash. The FM translator will be relocated to the Portland, Oregon market for use by our KDZR-AM radio station.
On June 28, 2017, we closed on the acquisition of an FM translator construction permit in Festus, Missouri for $40,000 in cash. The FM translator will be relocated to the St. Louis, Missouri market for use by our KXFN-FM radio station.
On March 14, 2017, we closed on the acquisition of an FM translator construction permit in Quartz Site, Arizona for $20,000 in cash. The FM translator will be relocated to the San Diego, California market for use by our KPRZ-AM radio station.
On March 1, 2017, we closed on the acquisition of an FM translator construction permit in Roseburg, Oregon for $45,000 in cash. The FM translator will be relocated to the Portland, Oregon market for use by our KPDQ-AM radio station.
On January 16, 2017, we closed on the acquisition of an FM translator in Astoria, Oregon for $33,000 in cash. The FM translator will be relocated to the Seattle, Washington market for use by our KGNW-AM radio station.
On January 6, 2017, we closed on the acquisition of an FM translator construction permit in Mohave Valley, Arizona for $20,000 in cash. The FM translator will be relocated to the San Diego, California market for use by our KCBQ-AM radio.
| 6 |
Acquisitions − Digital Media
On August 31, 2017, we acquired the TeacherTube.com website and related assets for $1.1 million in cash. TeacherTube.com is an online instructional video sharing community for teachers, students and parents.
On August 31, 2017, we acquired the Intelligence Report newsletter and related assets valued at $2.5 million and we assumed deferred subscription liabilities of $2.9 million. We paid no cash to the seller upon closing.
On July 6, 2017, we acquired the TradersCrux.com website and related assets for $0.3 million in cash. As part of the purchase agreement, we may pay up to an additional $0.1 million in contingent earn-out consideration within one year upon the achievement of income benchmarks.
On June 8, 2017, we acquired a Portuguese Bible mobile application and related assets for $65,000 in cash. As part of the purchase agreement, we may pay up to an additional $20,000 in contingent earn-out consideration over the next twelve months based on the achievement of certain revenue benchmarks.
On March 15, 2017, we acquired the website prayers-for-special-help.com and related assets for $0.2 million in cash.
A summary of our business acquisitions and asset purchases during the year ended December 31, 2017, none of which were individually or in the aggregate, material to our consolidated financial position as of the respective date of acquisition, is as follows:
| Acquisition Date | Description | Total Cost | ||||
| (Dollars in thousands) | ||||||
| November 22, 2017 | WWRC-AM (formerly WSPZ-AM) in Bethesda, Maryland (business acquisition) | $ | 620 | |||
| September 15, 2017 | Real property of radio station WSPZ-AM in Bethesda, Maryland (business acquisition) | 1,500 | ||||
| August 31, 2017 | TeacherTube.com (business acquisition) | 1,100 | ||||
| August 31, 2017 | Intelligence Reporter newsletter (business acquisition) | — | ||||
| July 24, 2017 | FM Translator construction permit, Eaglemount, Washington (asset acquisition) | 40 | ||||
| July 6, 2017 | TradersCrux.com (business acquisition) | 298 | ||||
| June 28, 2017 | FM Translator construction permit, Festus, Missouri (asset acquisition) | 40 | ||||
| June 8, 2017 | Portuguese Bible Mobile Applications (business acquisition) | 82 | ||||
| March 15, 2017 | Prayers for Special Help (business acquisition) | 245 | ||||
| March 14, 2017 | FM Translator construction permit, Quartz Site, Arizona (asset purchase) | 20 | ||||
| March 1, 2017 | FM Translator construction permit, Roseburg, Oregon (asset purchase) | 45 | ||||
| January 16, 2017 | FM Translator, Astoria, Oregon (asset purchase) | 33 | ||||
| January 1, 2017 | FM Translator construction permit, Mohave Valley, Arizona (asset purchase) | 20 | ||||
| $ | 4,043 | |||||
Divestitures
On December 28, 2017, we sold real property, including the land, tower and broadcasting facilities, of radio station WSPZ-AM (now WWRC-AM) in Bethesda, Maryland for $1.9 million in cash. We recorded a pre-tax gain on the sale of approximately $0.4 million.
On June 1, 2017, we received $0.6 million in cash for a former transmitter site in our Dallas, Texas market that we had leased to a third party.
Due to operating results that did not meet management’s expectations, we ceased publishing Preaching Magazine™, YouthWorker Journal™, FaithTalk Magazine™ and Homecoming™. The Magazine upon delivery of the May 2017 print publications. On May 30, 2017, we received $10,000 for Preaching Magazine™ and YouthWorker Journal™. The purchaser assumed all deferred subscription liabilities for these publications resulting in a pre-tax gain on the sale of assets of approximately $56,000.
On January 3, 2017, Word Broadcasting began operating our Louisville radio stations (WFIA-AM; WFIA-FM; WGTK-AM) under a twenty-four month Time Brokerage Agreement (“TBA”). We received $0.5 million in cash associated with an option for Word Broadcasting Network to acquire the radio stations during the term.
Pending Transactions
On December 29, 2017, we entered into two Local Marketing Agreements (“LMA”) to program radio stations KPAM-AM and KKOV-AM in Portland, Oregon. We began operating the radio stations on January 2, 2018. The LMA’s have a 12-month term.
On December 1, 2017, we entered into an agreement to sell radio station WQVN-AM (formerly WKAT-AM) in Miami, Florida for $3.5 million in cash. The buyer began operating the radio station under an LMA agreement as of the same date. The sale is expected to close during the first quarter of 2018. We recorded an estimated loss on the sale of assets of $4.7 million as of December 31, 2017, based on the probability of the sale, which reflected the sales price as compared to the carrying value of the assets and the estimated costs of the sale.
| 7 |
In August 2017, we received an escrow deposit under an agreement to sell land in Covina, California for $1.0 million dollars. The sale is subject to the buyer’s ability to complete due diligence on their expected use of the land and is expected to close in the latter half of 2020. We recorded the land in long-term assets held for sale based on the expected closing date and have not used the land in operations.
We are programming radio station KHTE-FM, Little Rock, Arkansas, under a 36 month TBA that began on April 1, 2015. The TBA is extendable for up to 48 months. We have the option to acquire the station for $1.2 million in cash during the TBA period. We are required to pay the licensee a $0.1 million fee if we do not exercise our option right to purchase the station.
Radio Stations
We own and/or operate 119 radio stations in 40 markets, including 74 stations in 23 of the top 25 markets, consisting of 34 FM radio stations and 85 AM radio stations. We also program the Family Talk™ Christian-themed talk format station on SiriusXM Channel 131. We are one of only three commercial radio broadcasters with radio stations in all of the top 10 markets. We are the sixth largest commercial radio broadcaster in the United States as measured by number of radio stations overall and the third largest operator as measured by number of stations in the top 25 markets.
We program our radio stations in five main formats: (1) Christian Teaching and Talk, (2) News Talk, (3) Contemporary Christian Music, (4) Spanish Language Christian Teaching and Talk and (5) Business.
Christian Teaching and Talk. We currently program 40 of our radio stations in our foundational format, Christian Teaching and Talk, which is talk programming emphasizing Christian and family themes. Through this format, a listener can hear Bible teachings and sermons, as well as gain insight to questions related to daily life, such as raising children or religious legal rights in education and in the workplace. This format uses block programming time to offer a learning resource and a source of personal support for listeners. Listeners often contact our programmers to ask questions, obtain materials on a subject matter or receive study guides based on what they have learned on the radio.
Block Programming. We sell blocks of airtime on our Christian Teaching and Talk format stations to a variety of national and local religious and charitable organizations that we believe create compelling radio programs. Historically, more than 95% of these religious and charitable organizations renew their annual programming relationships with us. Based on our historical renewal rates, we believe that block programming provides a steady and consistent source of revenue and cash flows. Our top ten programmers have remained relatively constant and average more than 30 years on-air. Over the last five years, block-programming revenue has generated 41% to 43% of our total net broadcast revenue.
Satellite Radio. We program SiriusXM Channel 131, the exclusive Christian Teaching and Talk channel on SiriusXM, reaching the entire nation 24 hours a day, seven days a week.
News Talk. We currently program 34 of our radio stations in a News Talk format. Our research shows that our News Talk format is highly complementary to our core Christian Teaching and Talk format. As programmed by Salem, both of these formats express conservative views and family values. Our News Talk format also provides for the opportunity to leverage syndicated talk programming produced by SRN to radio stations throughout the United States. Syndication of our programs allows Salem to reach audiences in markets in which we do not own or operate radio stations.
Contemporary Christian Music. We currently program 13 of our radio stations in a Contemporary Christian Music (“CCM”) format, branded The FISH® in most markets. Through the CCM format, we are able to bring listeners the words of inspirational recording artists, set to upbeat contemporary music. Our music format, branded “Safe for the Whole Family”, features sounds that listeners of all ages can enjoy and lyrics that can be appreciated. The CCM genre continues to be popular. We believe that the listener base for CCM is underserved in terms of radio coverage, particularly in larger markets, and that our stations fill an otherwise void area in listener choices.
Spanish Language Christian Teaching and Talk. We currently program seven of our radio stations in a Spanish Language Christian Teaching and Talk format. This format is similar to our core Christian Teaching and Talk format in that it broadcasts biblical and family-themed programming, but the programming is specifically tailored for Spanish-speaking audiences. Additionally, block programming on our Spanish Language Christian Teaching and Talk stations is primarily local while Christian Teaching and Talk stations are primarily national.
Business. We currently program 12 of our radio stations in a business format. Our business format features financial commentators, business talk, and nationally recognized Bloomberg programming. The business format operates similar to our Christian Teaching and Talk format in that it features long-form block programming.
| 8 |
The following table sets forth information about each of Salem’s stations, in order of market size:
| MSA | Station | Year | ||||||
| Market(1) | Rank(2) | Call Letters | Acquired | Format | ||||
| New York, NY | 1, 19 (3) | WMCA-AM | 1989 | Christian Teaching and Talk | ||||
| WNYM-AM | 1994 | News Talk | ||||||
| Los Angeles, CA | 2 | KKLA-FM | 1985 | Christian Teaching and Talk | ||||
| KRLA-AM | 1998 | News Talk | ||||||
| KFSH-FM | 2000 | Contemporary Christian Music | ||||||
| Chicago, IL | 3 | WYLL-AM | 2001 | Christian Teaching and Talk | ||||
| WIND-AM | 2005 | News Talk | ||||||
| San Francisco, CA | 4, 36 (4) | KFAX-AM | 1984 | Christian Teaching and Talk | ||||
| KDOW-AM | 2001 | Business | ||||||
| KTRB-AM | LMA | News Talk | ||||||
| Dallas-Fort Worth, TX | 5 | KLTY-FM | 1996 | Contemporary Christian Music | ||||
| KWRD-FM | 2000 | Christian Teaching and Talk | ||||||
| KSKY-AM | 2000 | News Talk | ||||||
| KTNO-AM | 2012 | Spanish Language Christian Teaching and Talk | ||||||
| KEXB-AM | 2015 | Business | ||||||
| Houston-Galveston, TX | 6 | KNTH-AM | 1995 | News Talk | ||||
| KKHT-FM | 2005 | Christian Teaching and Talk | ||||||
| KTEK-AM | 2011 | Business | ||||||
| Washington, D.C. | 7 | WAVA-FM | 1992 | Christian Teaching and Talk | ||||
| WAVA-AM | 2000 | Christian Teaching and Talk | ||||||
| WSPZ-AM (formerly WWRC-AM) | 2010 | Christian Teaching and Talk | ||||||
| WWRC-AM (formerly WSPZ-AM) | 2017 | News Talk | ||||||
| Atlanta, GA | 8 | WNIV-AM | 2000 | Christian Teaching and Talk | ||||
| WLTA-AM | 2000 | Christian Teaching and Talk | ||||||
| WAFS-AM | 2000 | Business | ||||||
| WFSH-FM | 2000 | Contemporary Christian Music | ||||||
| WGKA-AM | 2004 | News Talk | ||||||
| WDWD-AM | 2015 | Christian Teaching and Talk | ||||||
| Philadelphia, PA | 9 | WFIL-AM | 1993 | Christian Teaching and Talk | ||||
| WNTP-AM | 1994 | News Talk | ||||||
| Boston, MA | 10 | WEZE-AM | 1997 | Christian Teaching and Talk | ||||
| WROL-AM | 2001 | Christian Teaching and Talk | ||||||
| WWDJ-AM | 2003 | Spanish Language Christian Teaching and Talk | ||||||
| Miami, FL | 11 | WKAT-AM (formerly WHIM-AM) | 2008 | Spanish Language Christian Teaching and Talk | ||||
| WZAB-AM | 2009 | Business | ||||||
| WOCN-AM | 2014 | Other | ||||||
| Seattle-Tacoma, WA | 12 | KGNW-AM | 1986 | Christian Teaching and Talk | ||||
| KLFE-AM (5) | 1994 | News Talk | ||||||
| KNTS-AM (5) | 1997 | Spanish Language Christian Teaching and Talk | ||||||
| KKOL-AM | 1997 | Business | ||||||
| Detroit, MI | 13 | WDTK-AM | 2004 | News Talk | ||||
| WLQV-AM | 2006 | Christian Teaching and Talk | ||||||
| Phoenix, AZ | 14 | KKNT-AM | 1996 | News Talk | ||||
| KPXQ-AM | 1999 | Christian Teaching and Talk | ||||||
| KXXT-AM | 2014 | Christian Teaching and Talk | ||||||
| Minneapolis-St. Paul, MN | 15 | KKMS-AM | 1996 | Christian Teaching and Talk | ||||
| KDIZ-AM | 1998 | Other | ||||||
| WWTC-AM | 2001 | News Talk | ||||||
| KYCR-AM | 2015 | Business | ||||||
| San Diego, CA | 16 | KPRZ-AM | 1987 | Christian Teaching and Talk | ||||
| KCBQ-AM | 2000 | News Talk | ||||||
| Denver-Boulder, CO | 17 | KRKS-FM | 1993 | Christian Teaching and Talk | ||||
| KRKS-AM | 1994 | Christian Teaching and Talk | ||||||
| KNUS-AM | 1996 | News Talk | ||||||
| KBJD-AM (6) | 1999 | Spanish Language Christian Teaching and Talk | ||||||
| KDMT-AM | 2015 | Business |
| 9 |
| Tampa, FL | 18 | WTWD-AM (7) | 2000 | Christian Teaching and Talk | ||||
| WTBN-AM (7) | 2001 | Christian Teaching and Talk | ||||||
| WLCC-AM | 2012 | Spanish Language Christian Teaching and Talk | ||||||
| WGUL-AM | 2005 | News Talk | ||||||
| WWMI-AM | 2015 | Business | ||||||
| Portland, OR | 21 | KPDQ-FM | 1986 | Christian Teaching and Talk | ||||
| KPDQ-AM | 1986 | Christian Teaching and Talk | ||||||
| KFIS-FM | 2002 | Contemporary Christian Music | ||||||
| KRYP-FM | 2005 | Regional Mexican | ||||||
| KDZR-AM | 2015 | News Talk | ||||||
| KPAM-AM | LMA | News Talk | ||||||
| KKOV-AM | LMA | Other | ||||||
| St. Louis, MO | 22 | WSDZ-AM | 2015 | Other | ||||
| KXFN-AM | 2016 | News Talk | ||||||
| Riverside-San Bernardino, CA | 24 | KTIE-AM | 2001 | News Talk | ||||
| San Antonio, TX | 25 | KSLR-AM | 1994 | Christian Teaching and Talk | ||||
| KLUP-AM | 2000 | News Talk | ||||||
| KRDY-AM | 2014 | Spanish Language Christian Teaching and Talk | ||||||
| Sacramento, CA | 26 | KFIA-AM | 1995 | Christian Teaching and Talk | ||||
| KTKZ-AM | 1997 | News Talk | ||||||
| KSAC-FM | 2002 | Business | ||||||
| KKFS-FM | 2006 | Contemporary Christian Music | ||||||
| Pittsburgh, PA | 27 | WORD-FM | 1993 | Christian Teaching and Talk | ||||
| WPIT-AM | 1993 | Christian Teaching and Talk | ||||||
| WPGP-AM | 2015 | News Talk | ||||||
| Orlando, FL | 30 | WORL-AM | 2006 | News Talk | ||||
| WTLN-AM | 2006 | Christian Teaching and Talk | ||||||
| WBZW-AM | 2006 | Business | ||||||
| WDYZ-AM | 2015 | Spanish Language Christian Teaching and Talk | ||||||
| Cleveland, OH | 33 | WHKW-AM | 2000 | Christian Teaching and Talk | ||||
| WFHM-FM | 2001 | Contemporary Christian Music | ||||||
| WHK-AM | 2005 | News Talk | ||||||
| Columbus, OH | 35 | WRFD-AM | 1987 | Christian Teaching and Talk | ||||
| WTOH-FM | 2013 | News Talk | ||||||
| Nashville, TN | 42 | WBOZ-FM (8) | 2000 | Contemporary Christian Music | ||||
| WFFH-FM (8) | 2002 | Contemporary Christian Music | ||||||
| WFFI-FM (8) | 2002 | Contemporary Christian Music | ||||||
| Louisville, KY | 54 | WFIA-FM | 1999 | Operated by a third party under a TBA | ||||
| WGTK-AM | 2000 | Operated by a third party under a TBA | ||||||
| WFIA-AM | 2001 | Operated by a third party under a TBA | ||||||
| Greenville, SC | 58 | WGTK-FM | 2013 | News Talk | ||||
| WRTH-FM | 2014 | Classic Hits | ||||||
| WLTE-FM | 2014 | Classic Hits | ||||||
| Honolulu, HI | 62 | KAIM-FM | 2000 | Contemporary Christian Music | ||||
| KGU-AM | 2000 | Business | ||||||
| KHCM-AM | 2000 | Operated by a third party under a TBA | ||||||
| KHCM-FM | 2004 | Country Music | ||||||
| KGU-FM | 2004 | Christian Teaching and Talk | ||||||
| KKOL-FM | 2005 | Oldies | ||||||
| KHNR-AM | 2006 | News Talk | ||||||
| Sarasota-Bradenton, FL | 72 | WLSS-AM | 2005 | News Talk | ||||
| Omaha, NE | 73 | KGBI-FM | 2005 | Contemporary Christian Music | ||||
| KOTK-AM | 2005 | News Talk | ||||||
| KCRO-AM | 2005 | Christian Teaching and Talk | ||||||
| Little Rock, AR | 85 | KDIS-FM | 2014 | Christian Teaching and Talk | ||||
| KKSP-FM | 2015 | Contemporary Christian Music | ||||||
| KHTE-FM | LMA | News Talk |
| 10 |
| Colorado Springs, CO | 88 | KGFT-FM | 1996 | Christian Teaching and Talk | ||||
| KBIQ-FM | 1996 | Contemporary Christian Music | ||||||
| KZNT-AM | 2003 | News Talk | ||||||
| Oxnard-Ventura, CA | 119 | KDAR-FM | 1974 | Christian Teaching and Talk | ||||
| Youngstown-Warren, OH | 130 | WHKZ-AM | 2001 | Christian Teaching and Talk | ||||
| Warrenton, VA | WRCW-AM | 2012 | News Talk |
| (1) | Actual city of license may differ from metropolitan market served. |
| (2) | All metropolitan statistical area (“MSA”) rank information used in this annual report on Form 10-K, excluding information concerning The Commonwealth of Puerto Rico, is from the Fall 2017 Radio Market Survey Schedule & Population Rankings published by Nielsen. According to the Radio Market Survey, the population estimates are based upon the 2010 U.S. Bureau Census estimates updated and projected to January 1, 2018 by Nielsen Demographics. |
| (3) | This market includes the Nassau-Suffolk, NY Metro market, which independently has a MSA rank of 19. |
| (4) | This market includes the San Jose, CA market, which independently has a MSA rank of 36. |
| (5) | KNTS(AM) is an expanded band AM station paired with KLFE(AM). The licenses for these stations include a condition that the most recent license renewal was granted subject to the resolution of AM expanded band dual operating authority issues in MB Docket No. 07-294. |
| (6) | KBJD(AM) is an expanded band AM station paired with KRKS(AM). The licenses for these stations include a condition that the most recent license renewal was granted subject to the resolution of AM expanded band dual operating authority issues in MB Docket No. 07-294. |
| (7) | WTBN-AM is simulcast with WTWD-AM, Tampa, FL. |
| (8) | WBOZ-FM is trimulcast with WFFH-FM, Nashville, TN and WFFI-FM, Nashville, TN. |
Broadcast revenue includes radio advertising spots, programming revenue, digital revenues from each of our radio station websites, digital email blasts, event revenue, and network advertising revenue. The principal source of network broadcast revenue is from the sale of spot advertising time. Salem Consumer Products, our e-commerce site, generates broadcast revenue from the sale of host content materials:
Advertising Revenue. We recognize advertising revenue from radio stations as the spots air or are delivered. For the year ended December 31, 2017, we derived 29.8% of our net broadcast revenue, or $58.4 million, from the sale of local spot advertising and 7.0% of our net broadcast revenue, or $13.7 million, from the sale of national spot advertising.
Programming Revenue. We recognize programming revenue as the programs air. For the year ended December 31, 2017, we derived 24.8% and 17.8% of our net broadcast revenue, or $48.6 million and $34.9 million, respectively, from the sale of national and local block programming time, respectively. National program revenue is primarily generated from geographically diverse, well-established non-profit religious and educational organizations that purchase time on our stations in a large number of markets in the United States. National program producers typically purchase 121/2, 25 or 50-minute blocks of time on a Monday through Friday basis and may offer supplemental programming for weekend release. We obtain local program revenue from community organizations and churches that typically purchase blocks for weekend releases and from local speakers who generally purchase daily releases. We believe that our management team is successful in identifying and assisting quality local programs for expansion into national syndication.
Network Revenue. SRN’s net revenue, including commission revenue for SMR, for the year ended December 31, 2017 was $18.1 million, or 9.2% of net broadcast revenue.
Digital Media
Our digital media-based businesses provide Christian, conservative, investing and health-themed content, e-commerce, audio and video streaming, and other resources digitally through the web. Revenue generated from our digital media operating segment includes advertising arrangements based on cost-per-click or performance-based advertising; display advertisements where revenue is dependent upon the number of page views; and lead generation advertisements where revenue is dependent upon users registering for, purchasing or demonstrating an interest in our advertisers' products or services. We also generate revenue from digital subscriptions, streaming, downloads and product sales through our church product sites, investing websites and health websites. Revenue is recognized upon digital delivery or page views, downloads and upon shipment of products. Revenue from this operating segment is reported as Digital Media revenue on our consolidated statements of operations included in Item 8 of this annual report on Form 10-K.
We own and operate numerous websites including:
Salem Web Network™ Christian Content Websites:
BibleStudyTools.com™ is a free Bible website for verse search and in-depth studies featuring commentaries, reading plans, and other helpful resources designed as aids to Bible study.
| 11 |
Crosswalk.com® offers compelling, editorial-driven, biblically based, lifestyle and devotional content to Christians who take seriously their relationship with Christ.
GodVine.com™ is an online platform designed to share inspirational, family-friendly video through Facebook and other social media outlets.
iBelieve.com creates editorial-driven, lifestyle content, focused on helping Christian women use personal experience to examine the deeper issues of life and faith.
GodTube.com™ is a video viewing platform for Christian videos with faith-based, family-friendly content.
OnePlace.com™ is a leading provider of on-demand, online audio streaming for nearly 200 radio programs from more than 185 popular Christian broadcast ministries. Oneplace.com serves as both a complement to and an extension of our block programming Christian radio business.
Christianity.com™ offers engaging articles and video focused on exploring the deeper, theological issues and apologetics of the Christian faith. It is also a leading provider of online Bible trivia games.
GodUpdates.com provides inspiring stories, thought-provoking articles and videos about topics important to Christians.
CrossCards.com™ provides faith-based, inspirational e-greeting cards for all occasions.
ChristianHeadlines.com reports the news of importance to the Christian audience with a headlines blog, Christian worldview commentary, and features on events from the worldwide Christian Church.
LightSource.com™ provides on-demand, video streaming for nearly 85 Christian television programs from more than 70 ministry partners.
AllCreated.com offers recipes, clever life hacks, no-sense beauty tips and simple do-it-yourself projects for your home.
ChristianRadio.com™ directs visitors towards Christian Teaching Talk Stations and Christian Music Stations in their state from Salem Radio Network.
CCMmagazine.com™ provides information and insight on Christian music.
SingingNews.com™ provides information on Southern Gospel artists, industry news, concerts, and more.
SouthernGospel.com™ features the latest in new music, news, stories, tours and features the most vibrant Southern Gospel community on the web.
Townhall Media — Conservative Opinion Websites:
Townhall.com™ is an interactive community that brings users, conservative public policy organizations, congressional staff and political activists together under the broad umbrella of conservative thoughts, ideas and actions.
HotAir.com™ is a leading news and commentary site with conservative news and opinions.
Twitchy.com is a website featuring selected quotes and current events centered on U.S. politics, global news, sports, entertainment, media, and breaking news.
RedState.com is the leading conservative, political news blog for right of center activists.
BearingArms.com is a clearinghouse for news and resources on Second Amendment issues, gun control, self-defense and firearms.
Human Events.com is a conservative opinion website that provides news and commentary on issues of interest to the conservative community.
ConservativeRadio.com is a connection to the most informative, intelligent talk radio hosts, both national hosts and local hosts, from stations across the country.
| 12 |
Salem Church Products Websites:
Salem Church Products websites offer resources for churches and ministries in the areas of church media, worship, children’s and youth ministry, preaching, teaching and employment. These websites include:
SermonSearch.com™ is a subscription-based resource for preachers and teachers with preparation materials like sermon outlines, illustrations, and preaching ideas from many of America’s top Christian communicators.
ChurchStaffing.com™ is a source of job search information for churches and ministries offering a platform for personnel and staff relations. This site allows those seeking employment to submit resumes and view job listings.
WorshipHouseMedia.com is an online church media resource, providing videos and other multi-media resources to churches to enhance worship and sermons.
SermonSpice.com is an online provider of church media for local churches and ministries.
WorshipHouseKids.com provides children’s and family ministry videos and media to make children’s ministry fun, interactive and easy.
Preaching.com is a leading resource for pastors and church leaders that offers tools and ideas to help them lead well.
ChristianJobs.com™ provides services catering to the hiring needs of Christian-based businesses, nonprofit organizations, and ministries. The site connects these organizations with thousands of job seekers through its online presence and partnerships with Salem’s radio stations.
Youthworker.com offers a wealth of resources specifically for student ministries to help enhance teaching and worship.
Digital Financial Websites and Publications
Our digital platform includes the following investing websites and publications:
Eagle Financial Publications - provides market analysis and investment strategies for individual subscribers to newsletters from a variety of investing commentators including Mark Skousen, Bob Carlson, Jim Woods and Brian Perry.
www.DividendInvestor.com - offers stock screening tools and dividend information for individual subscribers to obtain dividend information and data.
www.StockInvestor.com - provides market analysis and investment strategies, recommendations, and opinions for individuals interested in the stock market.
newportnaturalhealth.com - Newport Natural Health (“NNH”) is an e-commerce website operated by Eagle Wellness that offers health advice and wellness products. NNH provides insightful health advice and is a trusted source of high quality nutritional supplements from Leigh Erin Connealy, MD, who is the medical director of a medical practice where she practices integrative medicine.
Digital Mobile Applications
Our digital mobile applications, available in iOS and/or Android platforms, provide another means by which our content is available to our audiences. Our mobile applications include the following:
| · | Daily Bible Devotion |
| · | King James Bible |
| · | Daily Bible |
| · | Christian Radio |
| · | OnePlace |
| · | Light Source |
| · | ¡Citas y Mas Citas! |
| · | Bíblia Portuguese Bible |
| · | Bibliya Tagalog Bible |
| · | Japanese Bible |
| · | La Bibbia |
| · | La Biblia Reina Valera |
| · | Louis Segond French Bible |
| · | Luther Bible German |
| · | Spanish Bible Reina Valera |
| 13 |
| · | Vietnamese Bible |
| · | Vulgate Latin Bible |
| · | Twitchy |
| · | HotAir |
| · | Townhall |
| · | Red State |
| · | Bible Study Tools |
| · | Bible Quotes |
| · | Bible Trivia |
| · | iBelieve |
| · | Bible Baseball Trivia |
| · | Christian Ecards |
Publishing
Our publishing operating segment includes three businesses: (1) book publishing, (2) self-publishing services and (3) one print magazine.
Regnery Publishing, with nearly a 70-year history, is one of the nation's leading publishers of conservative, Christian and history books. Having published many of the seminal works of the early conservative movement, Regnery today continues as a leading publisher in the conservative space, with leading authors including Ann Coulter, Dinesh D’Souza, Newt Gingrich, David Limbaugh, Ed Klein and Mark Steyn.
Salem Author Services, our print-on-demand self-publishing service for authors, includes Xulon Press™, Mill City Press and Bookprinting.com. Xulon Press™ publishes books for Christian authors while Mill City Press and Bookprinting.com publish books for all general market genres.
Singing News® magazine, previously Salem Publishing™, is our print magazine.
COMPETITION
We operate in a highly competitive broadcast and media business. We compete for audiences, advertisers and programmers with other radio broadcasters, broadcast and cable television operators, newspapers and magazines, book publishers, national and local digital services, outdoor advertising, direct mail, online marketing and media companies, social media platforms, web-based blogs, and mobile devices.
BROADCASTING. Our broadcast audience ratings and market shares are subject to change, and any change in a particular market could adversely affect on the revenue of our stations located in that market. While we already compete in some of our markets with stations that offer similar formats, if another radio station were to convert its programming to a format similar to one of ours, or if an existing competitor were to strengthen its operations, our stations could suffer reduced ratings and/or reduced revenues. In these circumstances, we could also incur significantly higher promotional and other related expenses. We cannot assure that our stations will maintain or increase their current audience ratings and revenues.
We compete for advertising revenue with other commercial religious format stations as well as general format radio stations. Our competition for advertising dollars includes other radio stations as well as broadcast television, cable television, newspapers, magazines, direct mail, online and billboard advertising, some of which may be controlled by horizontally integrated companies. Several factors can materially affect competitive advantage, including, but not limited to audience ratings, program content, management talent and expertise, sales talent and experience, audience characteristics, signal strength, and the number and characteristics of other radio stations in the same market.
Christian and Family-Themed Radio. The segment of this industry that focuses on Christian and family themes is also a highly competitive business. The financial success of each of our radio stations that focuses on Christian Teaching and Talk is dependent, to a significant degree, upon its ability to generate revenue from the sale of block program time to national and local religious and educational organizations. We compete for this program revenue with a number of different commercial and non-commercial radio station licensees. While we believe that no commercial group owner in the United States specializing in Christian and family-themed programming approaches Salem in size of potential listening audience and presence in major markets, other religious radio stations exist and enjoy varying degrees of prominence and success in each of our markets.
New Methods of Content Delivery. Competition also comes from new media technologies and services. These include delivery of audio programming by cable television and satellite systems, digital audio radio services, mobile devices including smart phone applications for iPhone® and Android®, personal communications services and the service of low powered, limited coverage FM radio stations authorized by the FCC. The delivery of live and stored audio programming through the Internet has also created new competition. In addition, satellite delivered digital audio radio, which delivers multiple audio programming formats to national audiences, has created competition. We have attempted to address these existing and potential competitive threats through a more active strategy to acquire and integrate new electronic communications formats including Internet acquisitions made by SWN and our exclusive arrangement to provide Christian and family-themed talk on SiriusXM, a satellite digital audio radio service.
| 14 |
NETWORK. SRN competes with other commercial radio networks that offer news and talk programming to religious and general format stations and noncommercial networks that offer Christian music formats. SRN also competes with other radio networks for the services of talk show personalities.
DIGITAL MEDIA. Salem Web Network™ and Townhall Media compete for visitors and advertisers with other companies that deliver online audio programming and Christian and conservative digital content as well as providers of general market websites. The online media and distribution business changes quickly and is highly competitive. We compete to attract and maintain interactions with advertisers, consumers, content creators and web publishers. Salem Church Products competes for customers with other online sites that offer resources useful in ministries, preaching, teaching and for employment within the Christian community. Our wellness products compete in a large, highly fragmented industry that includes specialty retailers, supermarkets, drugstores, mass merchants, multi-level marketing organizations, mail-order companies, other online retailers and pharmaceuticals.
PUBLISHING. Regnery Publishing competes with other book publishers for readers and book sales as well as competes for product quality, customer service, suitability of format and subject matter, author reputation, price, timely availability of both new titles and revisions of existing books, digital availability of published products, and timely delivery of products to customers. Our print magazine competes for readers and advertisers with other print publications, including those geared toward Christian audiences. Salem Author Services competes for authors with other on-demand publishers including those focused exclusively on Christian book publishers.
Federal Regulation of Radio Broadcasting
Introduction. The ownership, operation and sale of broadcast stations, including those licensed to Salem, are subject to the jurisdiction of the FCC, which acts under authority derived from The Communications Act of 1934, as amended, and the rules and regulations promulgated thereunder (the “Communications Act”). Among other things, the FCC assigns frequency bands for broadcasting; determines whether to approve certain changes in ownership or control of station licenses; regulates transmission facilities, including power employed, antenna and tower heights, and location of transmission facilities; adopts and implements regulations and policies that directly or indirectly affect the ownership, operation and employment practices of stations; and has the power to impose penalties for violations of its rules under the Communications Act.
The following is a brief summary of certain provisions of the Communications Act and of specific FCC regulations and policies. Failure to observe these or other rules and policies can result in the imposition of various sanctions, including monetary forfeitures, the grant of “short” (less than the maximum) license renewal terms or, for particularly egregious violations, the denial of a license renewal application, the revocation of a license or the denial of FCC consent to acquire additional broadcast properties. For further information concerning the nature and extent of federal regulation of broadcast stations you should refer to the Communications Act, FCC rules and the public notices and rulings of the FCC.
License Grant and Renewal. Radio broadcast licenses are granted for maximum terms of eight years. Licenses must be renewed through an application to the FCC. Under the Communications Act, the FCC will renew a broadcast license if it finds that the station has served the public interest, convenience and necessity, that there have been no serious violations by the licensee of the Communications Act or the rules and regulations of the FCC, and that there have been no other violations by the licensee of the Communications Act or the rules and regulations of the FCC that, when taken together, would constitute a pattern of abuse.
Petitions to deny license renewals can be filed by certain interested parties, including members of the public in a station’s market. Such petitions may raise various issues before the FCC. The FCC is required to hold hearings on renewal applications if the FCC is unable to determine that renewal of a license would serve the public interest, convenience and necessity, or if a petition to deny raises a “substantial and material question of fact” as to whether the grant of the renewal application would be prima facie inconsistent with the public interest, convenience and necessity. In addition, during certain periods when a renewal application is pending, the transferability of the applicant’s license is restricted.
The following table sets forth information with respect to each of our radio stations for which we hold the license. Stations that we operate under an LMA or TBA are not reflected on this table. A broadcast station’s market may be different from its community of license. The coverage of an AM radio station is chiefly a function of the power of the radio station’s transmitter, less dissipative power losses and any directional antenna adjustments. For FM radio stations, signal coverage area is chiefly a function of the Effective Radiated Power (“ERP”) of the radio station’s antenna and the Height Above Average Terrain (“HAAT”) of the radio station’s antenna.
| 15 |
| Market(1) | Station Call Letters |
Frequency | Operating Frequency |
Expiration Date
of License |
FCC Class |
Height Above Average Terrain (in feet) |
Power (in Kilowatts)Day / Night | |||||||
| New York, NY | WMCA | AM | 570 | June 2022 | B | N/A | 5 / 5 | |||||||
| WNYM | AM | 970 | June 2022 | B | N/A | 50 / 5 | ||||||||
| Los Angeles, CA | KKLA | FM | 99.5 | December 2021 | B | 2,959 | 10 | |||||||
| KRLA | AM | 870 | December 2021 | B | N/A | 50 / 3 | ||||||||
| KFSH | FM | 95.9 | December 2021 | A | 328 | 6 | ||||||||
| Chicago, IL | WYLL | AM | 1160 | December 2020 | B | N/A | 50 / 50 | |||||||
| WIND | AM | 560 | December 2020 | B | N/A | 5 / 5 | ||||||||
| San Francisco, CA | KFAX | AM | 1100 | December 2021 | B | N/A | 50 / 50 | |||||||
| KDOW | AM | 1220 | December 2021 | D | N/A | 5 / 0.145 | ||||||||
| Dallas-Fort Worth, TX | KLTY | FM | 94.9 | August 2021 | C | 1,667 | 100 | |||||||
| KWRD | FM | 100.7 | August 2021 | C | 1,988 | 98 | ||||||||
| KSKY | AM | 660 | August 2021 | B | N/A | 20 / 0.7 | ||||||||
| KTNO | AM | 1440 | August 2021 | B | N/A | 50 / 0.35 | ||||||||
| KEXB | AM | 620 | August 2021 | B | N/A | 5 / 4.5 | ||||||||
| Houston-Galveston, TX | KNTH | AM | 1070 | August 2021 | B | N/A | 10 / 5 | |||||||
| KKHT | FM | 100.7 | August 2021 | C | 1,952 | 100 | ||||||||
| KTEK | AM | 1110 | August 2021 | D | N/A | 2.5 | ||||||||
| Washington, D.C. | WAVA | FM | 105.1 | October 2019 | B | 604 | 33 | |||||||
| WAVA | AM | 780 | October 2019 | D | N/A | 12 | ||||||||
| WSPZ (formerly WWRC) |
AM | 1260 | October 2019 | B | N/A | 35 / 5 | ||||||||
| WWRC (formerly WSPZ) |
AM | 570 | October 2019 | O | N/A | 5 / 1 | ||||||||
| Atlanta, GA | WNIV | AM | 970 | April 2020 | D | N/A | 5 / 0.039 | |||||||
| WLTA | AM | 1400 | April 2020 | C | N/A | 1 / 1 | ||||||||
| WAFS | AM | 1190 | April 2020 | D | N/A | 25 | ||||||||
| WFSH | FM | 104.7 | April 2020 | C1 | 1,657 | 24 | ||||||||
| WGKA | AM | 920 | April 2020 | B | N/A | 14 / 0.49 | ||||||||
| WDWD | AM | 590 | April 2020 | B | N/A | 12 / 4.5 | ||||||||
| Philadelphia, PA | WFIL | AM | 560 | August 2022 | B | N/A | 5 / 5 | |||||||
| WNTP | AM | 990 | August 2022 | B | N/A | 50 / 10 | ||||||||
| Boston, MA | WEZE | AM | 590 | April 2022 | B | N/A | 5 / 5 | |||||||
| WROL | AM | 950 | April 2022 | D | N/A | 5 / 0.09 | ||||||||
| WWDJ | AM | 1150 | April 2022 | B | N/A | 5 / 5 | ||||||||
| WBIX | AM | 1260 | April 2022 | B | N/A | 5 / 5 | ||||||||
| Miami, FL | WQVN (formerly WKAT) | AM | 1360 | February 2020 | B | N/A | 5 / 1 | |||||||
| WKAT (formerly WHIM) |
AM | 1080 | February 2020 | B | N/A | 50 / 10 | ||||||||
| WZAB | AM | 880 | February 2020 | B | N/A | 4 / 5 | ||||||||
| WOCN | AM | 1450 | February 2020 | B | N/A | 1 / 1 | ||||||||
| Seattle-Tacoma, WA | KGNW | AM | 820 | February 2022 | B | N/A | 50 / 5 | |||||||
| KLFE | AM | 1590 | February 2022 | B | N/A | 20 / 5 | ||||||||
| KNTS | AM | 1680 | February 2022 | B | N/A | 10 / 1 | ||||||||
| KKOL | AM | 1300 | February 2022 | B | N/A | 50 / 47 | ||||||||
| Detroit, MI | WDTK | AM | 1400 | October 2020 | C | N/A | 1 / 1 | |||||||
| WLQV | AM | 1500 | October 2020 | B | N/A | 50 / 10 | ||||||||
| Phoenix, AZ | KKNT | AM | 960 | October 2021 | B | N/A | 5 / 5 | |||||||
| KPXQ | AM | 1360 | October 2021 | B | N/A | 50 / 1 | ||||||||
| KXXT | AM | 1010 | October 2021 | B | N/A | 15 / 0.25 | ||||||||
| Minneapolis-St. Paul, MN | KKMS | AM | 980 | April 2021 | B | N/A | 5 / 5 | |||||||
| KDIZ | AM | 1570 | April 2021 | B | N/A | 3.8 / 0.23 | ||||||||
| WWTC | AM | 1280 | April 2021 | B | N/A | 5 / 5 | ||||||||
| KYCR | AM | 1440 | April 2021 | B | N/A | 5 / 0.5 | ||||||||
| San Diego, CA | KPRZ | AM | 1210 | December 2021 | B | N/A | 20 / 10 | |||||||
| KCBQ | AM | 1170 | December 2021 | B | N/A | 50 / 2.9 | ||||||||
| Denver-Boulder, CO | KRKS | FM | 94.7 | April 2021 | C | 984 | 100 | |||||||
| KRKS | AM | 900 | April 2021 | B | N/A | 6.5 / 0.39 | ||||||||
| KNUS | AM | 710 | April 2021 | B | N/A | 5 / 5 | ||||||||
| KBJD | AM | 1650 | April 2021 | B | N/A | 10 / 1 | ||||||||
| KDMT | AM | 1690 | April 2021 | B | N/A | 10 / 1 |
| 16 |
| Tampa, FL | WTWD | AM | 910 | February 2020 | B | N/A | 5 / 5 | |||||||
| WTBN | AM | 570 | February 2020 | B | N/A | 5 / 5 | ||||||||
| WLCC | AM | 760 | February 2020 | B | N/A | 10 / 1 | ||||||||
| WGUL | AM | 860 | February 2020 | B | N/A | 5 / 1.5 | ||||||||
| WWMI | AM | 1380 | February 2020 | B | N/A | 9.8 / 6.5 | ||||||||
| Portland, OR | KPDQ | FM | 93.9 | February 2022 | C1 | 1,270 | 52 | |||||||
| KPDQ | AM | 800 | February 2022 | B | N/A | 1 / 0.5 | ||||||||
| KFIS | FM | 104.1 | February 2022 | C2 | 1,266 | 6.9 | ||||||||
| KRYP | FM | 93.1 | February 2022 | C3 | 1,270 | 1.6 | ||||||||
| KDZR | AM | 1640 | February 2022 | B | N/A | 10 / 1 | ||||||||
| St. Louis, MO | WSDZ | AM | 1260 | December 2020 | B | N/A | 20 / 5 | |||||||
| KXFN | AM | 1380 | December 2021 | B | N/A | 5 / 1 | ||||||||
| Riverside-San Bernardino, CA | KTIE | AM | 590 | December 2021 | B | N/A | 2.5 / 0.96 | |||||||
| San Antonio, TX | KSLR | AM | 630 | August 2021 | B | N/A | 5 / 4.3 | |||||||
| KLUP | AM | 930 | August 2021 | B | N/A | 5 / 1 | ||||||||
| KRDY | AM | 1160 | August 2021 | B | N/A | 10 / 1 | ||||||||
| Sacramento, CA | KFIA | AM | 710 | December 2021 | B | N/A | 25 / 1 | |||||||
| KTKZ | AM | 1380 | December 2021 | B | N/A | 5 / 5 | ||||||||
| KSAC | FM | 105.5 | December 2021 | B1 | 1,010 | 2.55 | ||||||||
| KKFS | FM | 103.9 | December 2021 | A | 328 | 6 | ||||||||
| Pittsburgh, PA | WORD | FM | 101.5 | August 2022 | B | 528 | 43 | |||||||
| WPIT | AM | 730 | August 2022 | D | N/A | 5 / 0.024 | ||||||||
| WPGP | AM | 1250 | August 2022 | B | N/A | 5 / 5 | ||||||||
| Orlando, FL | WORL | AM | 660 | February 2020 | B | N/A | 3.5 / 1 | |||||||
| WTLN | AM | 950 | February 2020 | B | N/A | 12 / 5 | ||||||||
| WBZW | AM | 1520 | February 2020 | B | N/A | 5 / 0.35 | ||||||||
| WDYZ | AM | 990 | February 2020 | B | N/A | 50 / 14 | ||||||||
| Cleveland, OH | WHKW | AM | 1220 | October 2020 | B | N/A | 50 / 50 | |||||||
| WFHM | FM | 95.5 | October 2020 | B | 620 | 31 | ||||||||
| WHK | AM | 1420 | October 2020 | B | N/A | 5 / 5 | ||||||||
| Columbus, OH | WRFD | AM | 880 | October 2020 | D | N/A | 23 | |||||||
| WTOH | FM | 98.9 | October 2020 | A | 505 | 2.6 | ||||||||
| Nashville, TN | WBOZ | FM | 104.9 | August 2020 | A | 328 | 6 | |||||||
| WFFH | FM | 94.1 | August 2020 | A | 453 | 3.2 | ||||||||
| WFFI | FM | 93.7 | August 2020 | A | 755 | 1.15 | ||||||||
| Louisville, KY | WFIA | FM | 94.7 | August 2020 | A | 394 | 3.3 | |||||||
| WGTK | AM | 970 | August 2020 | B | N/A | 5 / 5 | ||||||||
| WFIA | AM | 900 | August 2020 | D | N/A | 0.93 / 0.162 | ||||||||
| Greenville, SC | WGTK | FM | 94.5 | December 2019 | 0 | 1,490 | 100 | |||||||
| WRTH | FM | 103.3 | December 2019 | 0 | 479 | 2.7 | ||||||||
| WLTE | FM | 95.9 | December 2019 | A | 233 | 6 | ||||||||
| Honolulu, HI | KHNR | AM | 690 | February 2022 | B | N/A | 10 / 10 | |||||||
| KAIM | FM | 95.5 | February 2022 | C | 1,854 | 100 | ||||||||
| KGU | AM | 760 | February 2022 | B | N/A | 10 / 10 | ||||||||
| KHCM | FM | 97.5 | February 2022 | C1 | 46 | 80 | ||||||||
| KHCM | AM | 880 | February 2022 | B | N/A | 2 / 2 | ||||||||
| KGU | FM | 99.5 | February 2022 | C | 1,965 | 100 | ||||||||
| KKOL | FM | 107.9 | February 2022 | C | 1,965 | 100 | ||||||||
| Sarasota-Bradenton, FL | WLSS | AM | 930 | February 2020 | B | N/A | 5 / 3 | |||||||
| Omaha, NE | KGBI | FM | 100.7 | June 2021 | C0 | 1,014 | 100 | |||||||
| KOTK | AM | 1420 | June 2021 | B | N/A | 1 / 0.33 | ||||||||
| KCRO | AM | 660 | June 2021 | D | N/A | 1 / 0.054 | ||||||||
| Little Rock, AR | KDIS | FM | 99.5 | June 2020 | 0 | 312 | 6 | |||||||
| KKSP | FM | 93.3 | June 2020 | 0 | 699 | 22 | ||||||||
| Colorado Springs, CO | KGFT | FM | 100.7 | April 2021 | C | 2,218 | 78 | |||||||
| KBIQ | FM | 102.7 | April 2021 | C | 2,280 | 72 | ||||||||
| KZNT | AM | 1460 | April 2021 | B | N/A | 5 / 0.5 |
| 17 |
| Oxnard-Ventura, CA | KDAR | FM | 98.3 | December 2021 | B1 | 1,289 | 1.5 | |||||||
| Youngstown-Warren, OH | WHKZ | AM | 1440 | October 2020 | B | N/A | 5 / 5 | |||||||
| Warrenton, Virginia | WRCW | AM | 1250 | October 2019 | D | N/A | 3 / 0.125 |
Radio station KNTS-AM is an expanded band station paired with station KLFE-AM in the Seattle, WA market, and station KBJD-AM is an expanded band station paired with KRKS-AM in the Denver, CO market. We are operating these four stations pursuant to FCC licenses or other FCC authority pending resolution by the FCC of the issue of AM expanded band dual operating authority. Depending upon how the FCC resolves that issue, it is possible that we will be required to surrender one station license in each station pair. Except for these stations, we are not currently aware of any facts that would prevent the timely renewal of our licenses to operate our radio stations, although there can be no assurance that our licenses will be renewed.
The following table sets forth information with respect to each of our radio stations FM translators for which we are the licensee and/or operate.
| Station | Operating | Expiration | FCC | Height Above Average |
Power (in Kilowatts) |
Power (in Kilowatts) | ||||||||
| Market | Call Letters | Frequency | Date of License | Class | Terrain (in feet) | Day | Night | |||||||
| Boston | W262CV (WROL) | 100.3 | 4/1/2022 | D | 164 | 0.25 | 0.25 | |||||||
| Cleveland | W245CY (WHKW) | 96.9 | 3/7/2018 | D | 520 | 0.005 | 0.005 | |||||||
| Cleveland | W273DG (WHK) | 102.5 | 3/7/2018 | D | 520 | 0.005 | 0.005 | |||||||
| Colorado Springs | K266CK (KZNT) | 101.1 | 4/1/2021 | D | (191) | 0.099 | 0.099 | |||||||
| Columbus | W240CX (WTOH) | 95.9 | 10/1/2020 | D | 696 | 0.99 | 0.525 | |||||||
| Columbus | W283CL (WRFD) | 104.5 | 10/1/2020 | D | 545 | 0.25 | 0.25 | |||||||
| Dallas-Ft. Worth | K273BJ (KTNO) | 102.5 | 8/1/2021 | D | 434 | 0.25 | 0.25 | |||||||
| Detroit | W224CC (WLQV) | 92.7 | 10/1/2020 | D | 924 | 0.099 | 0.099 | |||||||
| Detroit | W268CN (WDTK) | 101.5 | 10/1/2020 | D | 914 | 0.099 | 0.099 | |||||||
| Greenville | W245CH (WGTK-FM) | 96.9 | 12/1/2019 | D | 1,364 | 0.25 | 0.25 | |||||||
| Greenville | W275BJ (WGTK-FM) | 102.9 | 12/1/2019 | D | 1,390 | 0.25 | 0.25 | |||||||
| Honolulu | K232FL (KHNR) | 94.3 | 2/1/2022 | D | 204 | 0.25 | 0.25 | |||||||
| Honolulu | K236CR (KGU-AM) | 95.1 | 2/1/2022 | D | 204 | 0.25 | 0.25 | |||||||
| Houston | K241CM (KTEK) | 96.1 | 08/01/2021 | D | 542 | 0.25 | 0.25 | |||||||
| Houston | K277DE (KNTH) | 103.3 | 8/1/2021 | D | 514 | 0.25 | 0.25 | |||||||
| Louisville | W297BV (WFIA) | 107.3 | 8/1/2020 | D | 286 | 0.25 | N/A | |||||||
| Miami | W272DS (WQVN) | 102.3 | 8/24/2019 | D | 603 | 0.17 | 0.17 | |||||||
| Miami | W270CV (WOCN) | 101.9 | 2/1/2020 | D | 531 | 0.25 | 0.25 | |||||||
| Minneapolis | K298CO (WWTC) | 107.5 | 11/15/2019 | D | 176 | 0.25 | 0.25 | |||||||
| New York | W272DX (WMCA) | 102.3 | 11/17/2019 | D | 585 | 0.25 | 0.25 | |||||||
| Omaha | K233CO (KOTK) | 94.5 | 6/1/2021 | D | 315 | 0.25 | 0.25 | |||||||
| Omaha | K293CJ (KCRO) | 106.5 | 6/1/2021 | D | 462 | 0.06 | 0.06 | |||||||
| Orlando | W268CT (WDYZ) | 101.5 | 2/1/2020 | D | 323 | 0.25 | 0.25 | |||||||
| Orlando | W288CJ (WORL) | 105.5 | 2/1/2020 | D | 440 | 0.25 | 0.25 | |||||||
| Orlando | W235CR (WTLN) | 94.9 | 2/1/2020 | D | 434 | 0.25 | 0.25 | |||||||
| Pittsburgh | W223CS (WPGP) | 92.5 | 8/1/2022 | D | 475 | 0.133 | 0.133 | |||||||
| Pittsburgh | W243BW (WPIT) | 96.5 | 8/1/2022 | D | 466 | 0.25 | 0.25 | |||||||
| Portland | K294CP (KPDQ) | 106.3 | 1/9/2019 | D | 1,307 | 0.099 | 0.099 | |||||||
| Portland | K300DH (KDZR) | 107.9 | 12/8/2017 | D | 859 | 0.07 | 0.07 | |||||||
| Sacramento | K245AR (KFIA) | 105.7 | TBD | D | 291 | 0.25 | 0.25 | |||||||
| San Diego | K241CT (KCBQ) | 96.1 | 11/8/2017 | D | 1,063 | 0.05 | 0.05 | |||||||
| San Diego | K291CR (KPRZ) | 106.1 | TBD | D | 846 | 0.15 | 0.15 | |||||||
| Seattle | K281CQ (KGNW) | 104.1 | 2/1/2022 | D | 1,248 | 0.099 | 0.099 | |||||||
| St. Louis | K236CS (WSDZ) | 95.1 | 2/1/2021 | D | 371 | 0.099 | 0.099 | |||||||
| St. Louis | K287BY (KXFN) | 105.3 | 2/1/2021 | D | 371 | 0.099 | 0.099 | |||||||
| Tampa | W271CY (WTWD) | 102.1 | 2/1/2020 | D | 271 | 0.125 | 0.125 | |||||||
| Tampa | W282CI (WLCC) | 104.3 | 2/1/2020 | D | 335 | 0.25 | 0.25 | |||||||
| Tampa/Sarasota | W229BR (WLSS) | 93.7 | 2/1/2020 | D | 212 | 0.099 | 0.099 | |||||||
| Tampa/Sarasota | W276CR (WLSS) | 103.1 | 2/1/2020 | D | 315 | 0.25 | 0.25 |
| 18 |
Ownership Matters. The Communications Act prohibits the assignment of a broadcast license or the transfer of control of a broadcast license without the prior approval of the FCC. In determining whether to assign, transfer, grant or renew a broadcast license, the FCC considers a number of factors pertaining to the licensee, including compliance with various rules limiting common ownership of media properties, the “character” of the licensee and those persons holding “attributable” interests therein, and compliance with the Communications Act’s limitation on alien ownership, as well as compliance with other FCC policies, including equal employment opportunity requirements.
Under the Communications Act, a broadcast license may not be granted to or held by a corporation that has more than one-fifth of its capital stock owned or voted by aliens or their representatives, by foreign governments or their representatives, or by non-U.S. corporations. Under the Communications Act, there are limitations on the licensee of a broadcast license, that is held by any corporation that is controlled, directly or indirectly, by any other corporation more than one-fourth of whose capital stock is owned or voted by aliens or their representatives, by foreign governments or their representatives, or by non-U.S. corporations. These restrictions apply in modified form to other forms of business organizations, including partnerships. We therefore may be restricted from having more than one-fourth of our stock owned or voted by aliens, foreign governments or non-U.S. corporations, although the FCC has recently adopted streamlined waiver procedures for requests to exceed the statutory limits.
Multiple Ownership: The Communications Act and FCC rules also have generally restricted the common ownership, operation or control of radio broadcast stations serving the same local market, of a radio broadcast station and a television broadcast station serving the same local market, and of a radio broadcast station and a daily newspaper serving the same local market. The FCC also restricts the number of television stations an entity may own both in local markets and nationwide.
Our current ownership of radio broadcast stations complies with the FCC’s multiple ownership rules; however, these rules may limit the number of additional stations that we may acquire in the future in certain of our markets and could limit the potential buyers of any stations we may attempt to sell. The FCC is also required by the Communications Act to review its broadcast ownership rules every four years. During 2009, the FCC held a series of hearings designed to evaluate possible changes to its rules. In May 2010, the FCC formally initiated its 2010 quadrennial review of its media ownership rules with the issuance of a Notice of Inquiry (“NOI”). The NOI was intended to assist the Commission in establishing a framework within which to analyze whether its media ownership rules remain “necessary in the public interest as a result of competition,” due to the dramatic changes occurring in the media marketplace. Numerous parties filed comments and reply comments in response to the NOI. In June and July 2011, the FCC released to the public eleven economic studies related to its media ownership rules. In December 2011, the FCC issued a Notice of Proposed Rulemaking (“NPRM”) seeking comment on proposed rule changes in connection with the 2010 quadrennial review. In March 2014, the FCC issued a Further Notice of Proposed Rulemaking (“FNPRM”) seeking comment on specific proposed changes to its ownership rules in connection with the 2010 and 2014 quadrennial reviews of the broadcast ownership rules and consolidated its 2010 quadrennial review with the 2014 quadrennial review of the ownership rules. On August 25, 2016, the FCC released a Second Report and Order to close the 2010 and 2014 Quadrennial Review proceedings (2nd R & O”), wherein the FCC decided to retain its local radio ownership rules without modification. In November 2017, the FCC adopted an Order on Reconsideration of the 2nd R & O (“Reconsideration Order”), which repealed the Newspaper/Broadcast Cross-Ownership Rule, the Radio/Television Cross-Ownership Rule, and the attribution rule for television joint sales agreements. The Reconsideration Order also revised the Local Television Ownership Rule to eliminate the Eight-Voices Test and modified the Top-Four Prohibition. The Reconsideration Order largely retained the local radio ownership rules, but adopted a presumptive waiver approach for existing parent markets with multiple embedded markets. While still the subject of appeals, the Third Circuit denied a request for stay of the Reconsideration Order and many of the rule changes adopted therein have now gone into effect. We can make no determination as to what effect, if any, any such rule changes will have on us.
Attribution: Because of these multiple and cross-ownership rules, a purchaser of voting stock of the company that acquires an “attributable” interest in the company may violate the FCC’s rule if it also has an attributable interest in other television or radio stations, or in daily newspapers, depending on the number and location of those radio or television stations or daily newspapers. Such a purchaser also may be restricted in the other companies in which it may invest, to the extent that these investments give rise to an attributable interest. If an attributable stockholder of the company violates any of these ownership rules, the company may be unable to obtain from the FCC one or more authorizations needed to conduct its radio station business and may be unable to obtain FCC consents for certain future acquisitions.
The FCC generally applies its television/radio/newspaper cross-ownership rules and its broadcast multiple ownership rules by considering the “attributable,” or cognizable, interests held by a person or entity. A person or entity can have an interest in a radio station or television station or daily newspaper by being an officer, director, partner, member, or stockholder of a company that owns that station or newspaper. Whether that interest is cognizable under the FCC’s ownership rules is determined by the FCC’s attribution rules. If an interest is attributable, the FCC treats the person or entity who holds that interest as an “owner” of the radio station or television station or daily newspaper in question, and therefore subject to the FCC’s ownership rules. On December 22, 2011, the FCC issued an NPRM to seek comment on specific proposed changes to its ownership rules. In the NPRM, the FCC tentatively concluded to maintain its local radio ownership rules largely intact. Comments and Reply Comments have been received by the FCC in connection with the NPRM (2010 quadrennial review). In March 2014, the FCC issued a FNPRM seeking comment on specific proposed changes to its ownership rules in connection with the 2010 and 2014 quadrennial reviews of the broadcast ownership rules. On August 25, 2016, the FCC released the 2nd R & O to close the 2010 and 2014 Quadrennial Review proceedings. In the second report and order, the FCC readopted its Television Joint Sales Agreement (“JSA”) Attribution Rule adopted in the Report and Order in this proceeding, which makes certain television JSA’s attributable. No other changes were made to the attribution rules. The Reconsideration Order, however, repealed the attribution rule for television JSAs.
| 19 |
Proposed Changes. As noted above, in May 2010, the FCC formally initiated its 2010 quadrennial review of its media ownership rules with the issuance of a NOI. The NOI is intended to assist the Commission in establishing a framework within which to analyze whether its media ownership rules remain “necessary in the public interest as a result of competition,” due to the dramatic changes occurring in the media marketplace. Numerous parties have filed comments and reply comments in response to the NOI. In June and July 2011, the FCC released to the public eleven economic studies related to its media ownership rules. On December 22, 2011, the FCC issued an NPRM in the 2010 quadrennial review to seek comment on specific proposed changes to its ownership rules. In the 2010 quadrennial review NPRM, the FCC tentatively concluded to maintain its local radio ownership rules largely intact. Comments and Reply Comments were received by the FCC in connection with the NPRM. In March 2014, the FCC issued an FNPRM seeking comment on specific proposed changes to its ownership rules in connection with the 2010 and 2014 quadrennial reviews of the broadcast ownership rules and consolidated its 2010 quadrennial review with the 2014 quadrennial review of the ownership rules. On August 25, 2016, the FCC released a Second Report and Order to close the 2010 and 2014 Quadrennial Review proceedings. The FCC decided to retain its local radio ownership rules without modification. As noted above, the Reconsideration Order largely retained the local radio ownership rules. It is anticipated, however, that the FCC will initiate the 2018 Quadrennial Review proceedings in the near future and could propose changes to the local radio ownership rules. We can make no determination as to what effect, if any, such changes might have on us.
Federal Antitrust Considerations. The Federal Trade Commission (“FTC”) and the Department of Justice (“DOJ”), which evaluate transactions to determine whether those transactions should be challenged under the federal antitrust laws, are also active in their review of radio station acquisitions, particularly where an operator proposes to acquire additional stations in its existing markets.
For an acquisition meeting certain size thresholds, the Hart-Scott-Rodino Improvements Act (“HSR Act”) and the rules promulgated thereunder require the parties to file Notification and Report Forms with the FTC and the DOJ and to observe specified waiting period requirements before consummating the acquisition. At any time before or after the consummation of a proposed acquisition, the FTC or the DOJ could take such action under the antitrust laws, as it deems necessary or desirable in the public interest, including seeking to enjoin the acquisition or seeking divestiture of the business acquired or other assets of the company. The FTC or the DOJ may investigate acquisitions that are not required to be reported under the HSR Act under the antitrust laws before or after consummation. In addition, private parties may under certain circumstances bring legal action to challenge an acquisition under the antitrust laws. The DOJ also has stated publicly that it believes that LMAs and other similar agreements customarily entered into in connection with radio station transfers prior to the expiration of the waiting period under the HSR Act could violate the HSR Act.
We can provide no assurances that our acquisition strategy will not be adversely affected in any material respect by antitrust reviews.
GEOGRAPHIC FINANCIAL INFORMATION
Our advertisers and programmers are based in various locations throughout the United States. While no one customer or programmer currently accounts for 10% or more of our total revenues individually or in the aggregate, our broadcast operating segment is particularly dependent on advertising revenue generated from our Los Angeles and Dallas broadcast markets. Our Los Angeles radio stations generated 15.4% of our total net broadcasting advertising revenue for the year ended December 31, 2017, 15.1% of our total net broadcasting advertising revenue for the year ended December 31, 2016, and 14.7% of our total net broadcast advertising revenue for the year ended December 31, 2015. Our Dallas radio stations generated 19.3% of our total net broadcast advertising revenue for the year ended December 31, 2017, 20.8% of our total net broadcast advertising revenue for the year ended December 31, 2016 and 24.5% of our total net broadcast advertising revenue for the year ended December 31, 2015.
Because substantial portions of our broadcast advertising revenues are derived from our Los Angeles and Dallas markets, our ability to generate revenues in those markets could be adversely affected by local or regional economic downturns in these areas.
EMPLOYEES
As of February 13, 2018, we employed 1,590 total employees of which 1,186 were full time and 404 were part time. These employees consisted of 1,165 in broadcasting, 163 in digital media, 121 in publishing, and 141 corporate employees. We consider our relations with our employees to be good and none of our employees are covered by collective bargaining agreements.
| 20 |
We employ on-air personalities and we may enter into employment agreements with these on-air personalities in order to protect our interests in these relationships. However, on-air talent may be lost to competitors for a variety of reasons. While we do not believe that the loss of any one of our on-air personalities would adversely affect on our consolidated financial condition and results of operations, the loss of several key on-air personalities combined could adversely affect on our business.
AVAILABLE INFORMATION
Our Internet address is www.salemmedia.com. We make available free of charge on our investor relations website under the heading “SEC Filings” our Annual Reports on Form 10-K, Quarterly Reports on Form 10-Q, Current Reports on Form 8-K and any amendments to those reports filed or furnished pursuant to Section 13(a) or 15(d) of the Exchange Act. These reports are available as soon as reasonably practical after we electronically file them or furnish them to the SEC. Any information found on our website is not a part of or incorporated by reference into, this or any other report of the company filed with, or furnished to, the SEC.
You should carefully consider the risks described below before investing in our securities. Our business is subject to risks associated with general economic conditions, geopolitical events, competition, technological obsolescence and employee relations. The risks described below, along with risks not currently known to us or that we currently believe are immaterial, may impair our business operations and liquidity in unfavorable ways. We operate in a continually changing business environment in which new risk factors emerge from time to time. We can neither predict new risk factors, nor can we assess the impact, if any, these new risk factors may have on our business. The extent to which any risk factor, or combination of risk factors, may affect our business, financial condition and results of operations could seriously and materially influence the trading price of our common stock.
CERTAIN FACTORS AFFECTING SALEM
We may choose not to pursue potentially more profitable business opportunities outside of our Christian, conservative news talk and family-themed formats, or not to broadcast programming that violates our programming standards, either of which may adversely affect on our business.
We are fundamentally committed to broadcasting, digital and publishing formats and programming emphasizing Christian values, conservative family themes and news. We may choose not to switch to other formats or pursue potentially more profitable business opportunities due to this commitment, which could result in lower operating revenues and profits than we might otherwise achieve. We also do not intend to pursue business opportunities or broadcast programming that would conflict with our core commitment to Christian and family-themed formats or that would violate our programming standards, even if such opportunities or programming would be more profitable. Our decision not to pursue other formats, business opportunities and/or broadcast programming that is inconsistent with our programming standards may have a material and adverse effect on our business.
A few controlling stockholders exercise control over most matters submitted to a stockholder vote who may have interests that differ from other security holders. Therefore, they may take actions that are not in the interests of other security holders.
As of December 31, 2017, Edward G. Atsinger III (Chief Executive Officer), Stuart W. Epperson (Chairman), Nancy A. Epperson (wife of Chairman) and Edward C. Atsinger (son of Chief Executive Officer) controlled approximately 83.5% in aggregate of the voting power of our capital stock, including all of the outstanding shares of our Class B Common stock, each share of which is entitled to ten votes on matters subject to a stockholder vote. Thus, these four stockholders have the ability to control fundamental corporate transactions requiring stockholder approval, including but not limited to, the election of all of our directors, approval of merger transactions involving Salem and the sale of all or substantially all of Salem’s assets. The interests of any of these controlling stockholders may differ from the interests of our other security holders in a material manner.
Future sales by Edward G. Atsinger III (Chief Executive Officer), Stuart W. Epperson (Chairman), Nancy A. Epperson (wife of Chairman) and Edward C. Atsinger (son of Chief Executive Officer) of our Class A common stock could adversely affect its market price.
Edward G. Atsinger III (Chief Executive Officer), Stuart W. Epperson (Chairman), Nancy A. Epperson (wife of Chairman) and Edward C. Atsinger (son of Chief Executive Officer) own approximately 39.2% of our Class A common stock. The market for our Class A common stock could change substantially if these individuals were to sell large amounts of shares of Class A common stock in the public market.
| 21 |
RISKS ASSOCIATED WITH BUSINESS OPERATIONS
KEY EMPLOYEES
Our business is dependent upon the performance of key employees, on-air talent and program hosts, as well as our ability to attract new employees.
Our business is dependent upon the performance and continued efforts of certain key individuals, including Edward G. Atsinger III, our Chief Executive Officer, and Stuart W. Epperson, our Chairman of the Board. Notwithstanding that, we have entered into employment agreements with such individuals, the loss of the services of such key individuals could adversely affect us. Further, Mr. Epperson has radio interests unrelated to our operations that will continue to impose demands on his time and Mr. Atsinger has an interest in an aviation business unrelated to our operations that will continue to impose demands on his time. Our success is highly dependent upon the retention of these and other key employees throughout our organization. In addition, we are dependent upon our ability to continue to attract new employees with key skills to support continued business growth.
We also employ or independently contract with several on-air personalities and hosts of syndicated radio programs with significant loyal audiences on both a national level and in their respective local markets. Several of our on-air personalities have a presence that extends beyond our radio platforms into other strategic areas. Although we have entered into long-term agreements with some of our executive officers, key on-air talent and program hosts to protect our interests in those relationships, we can give no assurance that all or any of these key employees will remain with us or will retain their audiences. Competition for these individuals is intense and many of our key employees are at-will employees who are under no legal obligation to remain with us. Our competitors may choose to extend offers to any of these individuals on terms that we may be unable or unwilling to meet. In addition, any or all of our key employees may decide to leave for a variety of personal or other reasons beyond our control. Furthermore, the popularity and audience loyalty of our key on-air talent and program hosts is highly sensitive to rapidly changing public tastes. A loss of such popularity or audience loyalty is beyond our control and could limit our ability to generate revenues.
If we fail to maintain strong relationships with our authors and other creative talent, as well as to develop relationships with new creative talent, our business and financial performance could be materially and adversely affected.
Our business, in particular book publishing and financial publications, is highly dependent on maintaining strong relationships with the authors and other creative talent who produce the products and services sold to our customers. Any overall weakening of these relationships, or the failure to develop successful new relationships, could have a material adverse impact on our business and financial performance.
FACTORS AFFECTING REVENUE AND AUDIENCE GROWTH
We face significant competition, which we expect will continue to intensify, and we may not be able to maintain or improve our competitive position or market share.
We operate in a highly competitive broadcast and media business. We compete for advertisers and customers with other radio broadcasters, as well as with other media sources including broadcast and cable television, newspapers and magazines, national and local digital services, outdoor advertising, direct mail, online marketing and media companies, social media platforms, web-based blogs, and mobile devices. We face intense competition from a wide range of competitors, including online marketing and media companies, integrated social media platforms and other specialist and enthusiast websites.
Our broadcast audience ratings and market shares are subject to change, and any change in a particular market could adversely affect the revenue of our stations located in that market. Salem Web Network competes for visitors and advertisers with other companies that deliver online audio programming and Christian and conservative Internet content as well as providers of general market Internet sites. Our book publishing business competes for readers with other book publishers, including those targeted specifically at Christian and conservative audiences. Our print magazines compete for readers and advertisers with other print publications including those that follow the Christian music industry and those that address themes of interest to church leadership and the Christian audience. Salem Author Services competes for authors with other self-publishers.
| 22 |
The level of competition that we face could make it more difficult for us to provide value to our consumers, our advertisers and our content creators. The perceived level of value could result in increased pricing pressure, reduced profit margins, increased sales and marketing expenses, decreased website traffic and failure to increase, or the loss of, market share, any of which would likely harm our business, revenue, financial condition and results of operations. We cannot assure you that we will be able to compete successfully against current or future competitors.
If we are unable to maintain or grow our advertising revenues, our business, financial condition and operating results may be adversely affected.
Our radio stations, digital media and publishing businesses are to varying degrees dependent upon advertising for their respective revenues. We compete for advertising revenue with other commercial broadcasters, including faith-based and general format radio stations, as well as with other media outlets such as broadcast and cable television, newspapers, print magazines, direct mail, digital and billboard advertising. Due to this significant competition, we may not be able to maintain or increase our current advertising revenue. Any sustained economic downturn could negatively impact our ability to generate revenues. If we are unable to maintain and grow our advertising revenues, our business, financial condition and results of operations may be adversely affected.
Since the economic recession of 2008 and 2009, we have experienced a stabilization of advertising revenue. This stabilization excludes the beneficial impact of political advertising as such impact varies with the type and nature of elections. We cannot assure you that our advertising revenue will not be volatile in the future or that such volatility will not have adversely affect our business, financial condition or results of operations.
Our business generates revenue from the sale of advertising, and the reduction in spending by or loss of advertisers could harm our business.
We derive a substantial part of our total revenues from the sale of advertising. For the years ended December 31, 2017, 2016 and 2015, 36.8%, 38.3%, and 39.2% of our total broadcast revenues, respectively, were generated from the sale of broadcast advertising. We are particularly dependent on revenue from our Los Angeles and Dallas markets which generated 15.4% and 19.3%, respectively of our total of our total net broadcasting advertising revenue for the year ended December 31, 2017, 15.1% and 20.8%, respectively, of our total net broadcasting advertising revenue for the year ended December 31, 2016, and 14.7% and 24.5%, respectively, of our total net broadcasting advertising revenue for the year ended December 31, 2015. If for any reason we experience a significant reduction in advertising sales, particularly in either of these markets, our business may be adversely affected.
Our advertising revenues in certain markets are ratings-sensitive and subject to decline based on ratings agency projections.
Nielsen uses its own technology to collect data for its ratings service. The Portable People Meter TM (“PPM”) is a small device that does not require active manipulation by the end user and is capable of automatically measuring radio, television, Internet, satellite radio and satellite television signals that are encoded for the service by the broadcaster. The PPM offers a number of advantages over the traditional diary ratings collection system including ease of use, more reliable ratings data and shorter time periods between when advertising runs and when audience listening or viewing habits can be reported. PPM data can fluctuate when changes are made to the “panel” (a group of individuals holding PPM devices) and in markets where we subscribe to Nielsen under the PPM, our ratings tend to fluctuate even when there are no significant programming or competitive changes in the market. As a result, all of our stations are susceptible to inconsistencies in ratings that may or may not accurately reflect the actual number of listeners at any given time, which, in turn, may adversely affect our advertising revenues in markets where such revenues are ratings-sensitive.
If we cannot attract the anticipated listener, programmer and advertiser base for our newly-acquired radio stations, we may not recoup associated operating costs or achieve profitability for these radio stations.
We frequently acquire radio stations that previously broadcasted in formats other than our primary formats. We continue to program some of these stations in non-primary formats and we re-program others to one of our primary formats. During, and for a period after, the conversion of a radio station’s format, the radio station typically generates operating losses. The magnitude and duration of these losses depend on a number of factors, including the promotional and marketing costs associated with attracting listeners and advertisers to our radio station’s new format and the success of these efforts. There is no guarantee that the operation of these newly-acquired stations or our operations in new formats will attract a sufficient listener and advertiser base. If we are not successful in attracting the listener and advertiser base we anticipate, we may not recoup associated operating costs or achieve profitability for these newly-acquired radio stations.
| 23 |
If we do not maintain or increase our block programming revenues, our business, financial condition and operating results may be adversely affected.
The financial success of each of our radio stations that feature Christian Teaching and Talk programming is significantly dependent upon our ability to generate revenue from the sale of block programming time to national and local religious and educational organizations. Block programming accounted for 42.6% of our net broadcast revenue for the year ended December 31, 2017, 42.7% of our net broadcast revenue for the year ended December 31, 2016, and 41.9% of our net broadcast revenue for the year ended December 31, 2015. We compete for this program revenue with a number of commercial and non-commercial radio stations. Due to the significant competition for this block programming, we may not be able to maintain or increase our current block programming revenue, in which case, our business, financial condition and results of operations may be adversely affected.
If we are unable to continue to drive and increase visitors to our owned and operated websites and to our customer websites and convert these visitors into repeat users and customers cost-effectively, our business, financial condition and results of operations could be adversely affected.
We attract traffic to our owned and operated websites by offering content that is highly specific and that we believe is relevant to our audiences. How successful we are in these efforts depends, in part, upon our continued ability to create and distribute high-quality, commercially valuable content in a cost-effective manner at scale that connects consumers with content that meets their specific interests and effectively enables them to share and interact with the content and supporting communities. We may not be able to create content in a cost-effective manner or that meets rapidly changing consumer demand in a timely manner, if at all. Any such failure to do so may adversely affect user and customer experiences and reduce traffic driven to our websites that could adversely affect our business, revenue, financial condition and results of operations.
Even if we succeed in driving traffic to our owned and operated websites and to our customer websites, neither we nor our advertisers and customers may be able to monetize this traffic or otherwise retain consumers. Our failure to do so could result in decreases in customers and related advertising revenue, which could adversely affect our business, financial condition and results of operations.
The use of “third party cookies” may be rejected by audiences, be restricted, or be subject to unfavorable regulation, which could adversely affect our business, financial condition and results of operations.
Cookies are small text files that are used to gather data to support our products. Cookies are placed on an internet user’s computer and correspond to certain data sets on our servers. Cookies collect anonymous information, such as when an internet user views an ad, clicks on an ad, or visits one of our customers’ websites.
Cookies may be deleted or blocked by internet users. Commonly used internet browsers allow users to modify their browser settings to prevent first party or third party cookies from being accepted by their browsers. Internet users can also delete cookies and/or download “ad blocking” software that prevents cookies from being stored on a user ’s computer. If more internet users adopt these settings or delete their cookies more frequently than they currently do, our business could be harmed. The Safari browser currently blocks third party cookies by default, and other browsers may do so in the future. Unless such default settings in browsers are altered by internet users, we will be able to set fewer of our cookies in browsers, which could adversely affect our business. There have also been announcements that prominent advertising platforms plan to replace cookies with alternative web tracking technologies. These alternative mechanisms have not been described in technical detail, and have not been announced with any specific stated time line. It is possible that these companies may rely on proprietary algorithms or statistical methods to track web users without the deployment of cookies, or may utilize log-in credentials entered by users into other web properties owned by these companies, such as their digital email services, to track web usage without deploying third party cookies. Alternatively, such companies may build alternative and potentially proprietary user tracking methods into their widely-used web browsers.
If and to the extent that cookies are blocked and/or replaced by proprietary alternatives, our continued use of cookies may face negative consumer sentiment, reduce our market share, or otherwise place us at a competitive disadvantage. If cookies are replaced, in whole or in part, by proprietary alternatives, we may be obliged to license proprietary tracking mechanisms and data from companies that have developed them, which also compete with us as advertising networks, and we may not be able to obtain such licenses on economically favorable terms. If such proprietary web-tracking standards are owned by companies that compete with us, they may be unwilling to make that technology available to us.
| 24 |
If the methodologies of Internet search engines are modified, traffic to our websites and corresponding consumer origination volumes could decline.
We depend in part on various Internet search engines, including Google®, Bing®, and Yahoo!®, to direct a significant amount of traffic to our websites. Our ability to maintain the number of visitors directed to our websites through which we distribute our content by search engines is not entirely within our control. Changes in the methodologies used by search engines to display results could cause our websites to receive less favorable placements, which could reduce the number of unique visitors who link to our websites. Any reduction in the number of users directed to our websites could negatively affect our ability to earn revenue. If traffic on our websites declines, we may need to employ more costly resources to replace lost traffic, and such increased expense could adversely affect our business, financial condition and results of operations.
We may be unable to increase or maintain our digital advertising revenues, which could adversely affect our business, financial condition and results of operations.
We generate advertising revenue from the sale of digital display advertisements on our websites. Our ability to increase or maintain this advertising revenue is largely dependent upon the number of users actively visiting our websites. We also must increase user engagement with our advertisers in order to increase our advertising revenues. Additionally, digital advertising techniques are evolving, and if our technology and advertisement serving techniques do not evolve to meet the needs of advertisers, our advertising revenue could decline. Changes in our business model, advertising inventory or initiatives could also cause a decrease in our advertising revenue. Because digital media is a concentrated growth area for us, any decrease in revenues in these areas could adversely affect our business, financial condition and results of operations.
Digital advertisements are reportedly becoming a means to distribute viruses over the Internet. If this practice continues, it could result in consumers becoming less inclined to click through digital advertisements, which could adversely affect the demand for digital advertising. Additionally, we do not have long-term agreements with most of our digital advertisers. Any termination, change or decrease in our advertising relationships could adversely affect our revenues and profitability. If we do not maintain or increase our advertising revenues, our business, results of operations and financial condition could be adversely affected.
Wireless devices and mobile phones are used to access the Internet, and our online marketing services may not be as effective when accessed through these devices, which could harm our business, financial condition and results of operations.
The number of people who access the Internet through devices other than personal computers has increased substantially in the last several years. Our websites were originally designed for persons accessing the Internet on a desktop or laptop computer. The smaller screens, lower resolution graphics and less convenient typing capabilities of wireless devices and mobile phones may make it more difficult for visitors to respond to our offerings. In addition, the cost of mobile advertising is relatively high and may not be cost-effective for our services. We must also ensure that our licensing arrangements with third-party content providers allow us to make this content available on these devices. If we cannot effectively make our content, products and services available on these devices, fewer consumers may access and use our content, products and services. In addition, if our services continue to be less effective or less economically attractive for customers seeking to engage in advertising through these devices and this segment of Internet traffic grows at the expense of traditional computer Internet access, we will experience difficulty attracting website visitors and attracting and retaining customers and our business, financial condition and results of operations will be harmed.
Concentration of book publication sales may make it difficult for us to compete effectively in the publication market.
The sale of printed book publications is concentrated in national, regional, and online bookstore chains. These bookstore chains account for a vast majority of book publishing revenues. Due to this concentration of book publication sales, it may be difficult for us to compete effectively in the market, which could adversely affect our publishing revenues and growth prospects of our publishing business.
Our financial results would suffer if we fail to successfully meet market needs with our publishing business.
The sale of books represents a substantial part of revenues for Regnery Publishing. If we are unable to successfully develop and execute promotional strategies for new books that respond to customer trends, including trends related to demand for eBooks, or other technological changes, Regnery Publishing and Salem as a whole may suffer accordingly.
| 25 |
Our financial results would suffer if costs to produce our publications increase.
Paper and postage prices are difficult to predict and control. Paper is a commodity and its price can be subject to significant volatility. All of our paper supply contracts currently provide for price adjustments based on prevailing market prices; however, we historically have been able to realize favorable paper pricing through volume discounts. We cannot predict with certainty the magnitude of future price changes for paper and postage. Further, we may not be able to pass such increases on to our customers.
Our revenues and net operating income may not be sufficient to utilize deferred tax assets that could offset future taxable income.
As of December 31, 2017, we had deferred tax assets of $58.1 million, net of valuation allowances of $6.2 million, on our consolidated balance sheet included in this annual report on Form 10-K. We expect to utilize these deferred tax assets to reduce consolidated income tax liabilities over future periods. However, we may not be able to fully utilize these deferred tax assets if future taxable income and related income tax liabilities are insufficient to allow their use. We may be required to record a larger valuation allowance against these deferred tax assets if we believe that we are unable to utilize them, which would adversely affect our results of operations and financial position.
REPUTATION
Damage to our reputation could damage our businesses and our relationship with advertisers, block programmers and our audience.
Maintaining a positive reputation is critical to our ability to attract and maintain relationships with advertisers, block programmers and our audience. As a company that focuses on, among other things, Christian and family-themed content, in particular, damage to our reputation could therefore cause significant harm to our business and prospects. Harm to our reputation can arise from numerous sources, including, among others, employee misconduct, harm to the reputation of our national on-air hosts, litigation or regulatory action, failure to deliver minimum standards of service and quality, compliance failures and unethical behavior. Negative publicity regarding us, whether or not true, may also result in harm to our business prospects. Any damage to our reputation could harm our ability to attract and retain advertisers, customers and content creators, which could materially and adversely affect our financial condition and results of operations.
Unfavorable publicity or consumer perception of our wellness products, the ingredients they contain and any similar products distributed by other companies could cause fluctuations in our operating results and could adversely affect our reputation, the demand for our wellness products and our ability to generate revenue.
We are highly dependent upon consumer perception of the safety and quality of our wellness products and the ingredients they contain. Consumer perception of our wellness products and the ingredients they contain, as well as consumer perception of similar wellness products, can be significantly influenced by scientific research or findings, national media attention and other publicity about wellness product use. A wellness product may be received favorably, resulting in high sales associated with that product that may not be sustainable as consumer preferences change. Future scientific research or publicity could be unfavorable to the wellness product industry or any of our particular wellness products or the ingredients they contain and may not be consistent with earlier favorable research or publicity. A future research report or publicity that is perceived by our wellness product consumers as less favorable or that questions earlier research or publicity could adversely affect our ability to generate wellness product revenues. Unfavorable market perception of our wellness products could adversely affect our reputation, the demand for our wellness products, and our ability to generate wellness product revenues.
ECONOMIC CONDITIONS
We may be adversely affected by deteriorating economic conditions.
The risks associated with our businesses become more acute in periods of a slowing economy or recession, which are often accompanied by a decrease in advertising. A decline in the level of business activity of our advertisers could have an adverse effect on our revenues and profit margins. During economic slowdowns in the United States, many advertisers have reduced their advertising expenditures. While the precise impact of economic slowdowns on our business is difficult to predict, our exposure to several risks increases with a slowing economy or a recession, including but not limited to:
| • | Increasing pressure to sell advertising and block programming time at discounted rates; |
| • | Increases in the length of time to collect receivables and higher risks that accounts become uncollectible as our customers face tight credit markets; |
| • | Reductions in donations to ministries, which could negatively impact their ability to purchase and pay for block programming time; |
| • | We may be unable to find suitable replacements for ministries which can no longer purchase and pay for block programming; |
| 26 |
| • | Limitations on our ability to obtain additional financing to fund working capital, capital expenditures, acquisitions and other corporate requirements; |
| • | Limitations on our ability to pursue projects that could have been economically beneficial; and |
| • | Impairment losses on the value of our indefinite-lived intangible assets including broadcast licenses, goodwill, and mastheads and impairment losses on other long-lived assets. |
Our results of operations could be negatively impacted by weak economic conditions of an individual business sector.
A recession or downturn in the economy of any individual business sector could have a significant effect on us. An individual business sector (such as the automotive industry) that tends to spend more on advertising than other sectors, might be forced to maintain a reduced level of advertising expenditures for several years after economic recovery has been in progress. If that sector experiences a slower recovery than the economy in general, that sector may reduce its advertising expenditures further if additional downturns occur. If that sector’s spending represents a significant portion of our advertising revenues, any reduction in its advertising expenditures may negatively impact our results of operations.
We are exposed to credit risk on our trade accounts receivable. This risk is heightened during periods of uncertain economic conditions.
Amounts due to us under trade accounts receivable are not covered by collateral or credit insurance. While we have procedures to monitor and limit exposure to credit risk on our receivables, which risk is heightened during periods of uncertain economic conditions, there can be no assurance such procedures will effectively limit our credit risk and enable us to avoid losses, which could have could adversely affect our financial condition and results of operations.
General economic conditions, including a prolonged weakness in the economy, may affect consumer purchases, which could adversely affect our wellness product sales.
Our wellness product operating results are dependent on a number of factors impacting consumer spending, including general economic and business conditions; consumer confidence; wages and employment levels; the housing market; consumer debt levels; availability of consumer credit; credit and interest rates; fuel and energy costs; energy shortages; taxes; general political conditions, both domestic and abroad; and the level of customer traffic within shopping and selling environments. Consumer product purchases, including purchases of our wellness products, may decline during recessionary periods. A prolonged downturn or an uncertain outlook in the economy may materially and adversely affect our wellness product business, revenues and profits.
POTENTIAL LEGAL LIABILITIES
As a creator and a distributor of multimedia content, we face potential liability and expenses for legal claims based on the nature and content of the materials that we create and/or distribute, or that are accessible via our owned and operated websites and our network of customer websites. If we are required to pay damages or expenses in connection with these legal claims, our business, financial condition and results of operations may be harmed.
We rely on the work product of various content creators, both employees and non-employees, to produce original programs, articles and content for our radio programs, websites and print publications. We face potential liability based on a variety of theories, including defamation, negligence, unlawful practice of a licensed profession, copyright, trademark infringement, or other legal theories based on the nature, creation or distribution of this information, and under various laws, including the Lanham Act and the Copyright Act of 1976 (the “Copyright Act”). We may also be exposed to similar liability in connection with content that we do not create but that is posted to our owned and operated websites and to our network of customer websites by users and other third parties through forums, comments, personas and other social media features. In addition, it is also possible that visitors to our owned and operated websites and to our network of customer websites could make claims against us for losses incurred in reliance upon information provided on our owned and operated websites or our network of customer websites. These claims, whether brought in the United States or abroad, could divert management time and attention away from our business and result in significant costs to investigate and defend, regardless of the merit of these claims. If we become subject to these or similar types of claims and are not successful in our defense, we may be forced to pay substantial damages. While we run our content through a rigorous quality control process, including an automated plagiarism program, there is no guarantee that we will avoid future liability and potential expenses for legal claims based on the content of the materials that we create or distribute. Should the content distributed through our owned and operated websites and our network of customer websites violate the intellectual property rights of others or otherwise give rise to claims against us, we could be subject to substantial liability, which could negatively impact our business, financial condition and results of operations.
| 27 |
We could face liability for the information we publish in our financial newsletters, including information based on data we obtain from other parties.
We may be subject to claims for securities law violations, defamation (including libel and slander), negligence, or other claims relating to the information we publish in our financial newsletters. While we strive to minimize such risks, it is possible that we could be subject to investigations and potential enforcement actions by the SEC or civil liability for securities fraud to subscribers who invest on the basis of information provided in our financial newsletters and related materials or by the independent financial commentators who provide newsletter content. For example, subscribers may take legal action against us if they rely on published information or market analysis that contains an error or on market strategies that do not perform as described. Additionally, a company may claim that we have made a defamatory statement about it, its employees or its financial position. The authors of our newsletters also rely on a variety of outside parties as sources for some of the information we use in our published data. These sources include securities exchanges, fund companies, hedge funds, transfer agents, and other data providers. Accordingly, in addition to possible exposure for publishing incorrect information that results directly from our own errors, we could face liability based on inaccurate data provided to us by others or based upon the actions of the authors. Defending civil claims or being subject to SEC investigations or enforcement actions based on the information we publish in our financial newsletters could be expensive and time-consuming and could adversely impact our business, operating results, and financial condition.
The sale of our wellness products involves product liability and related risks that could expose us to significant insurance and loss expenses.
We face an inherent risk of exposure to wellness product liability claims if the use of our wellness products results in, or is believed to have resulted in, illness or injury. Most of our wellness products contain combinations of ingredients, and there is little long-term experience with the effect of these combinations. In addition, interactions of these wellness products with other products, prescription medicines and over-the-counter drugs have not been fully explored or understood and may have unintended consequences. While our third party manufacturers perform tests in connection with the formulations of our wellness products, these tests are not designed to evaluate the inherent safety of our wellness products.
Although we maintain product liability insurance, it may not be sufficient to cover all product liability claims and such claims that may arise could adversely affect our business and financial condition. We carry product liability insurance coverage that requires us to pay deductibles/retentions with primary and excess liability coverage above the deductible/retention amount. Because of our deductibles and self-insured retention amounts, we have significant exposure to fluctuations in the number and severity of claims. The successful assertion or settlement of an uninsured claim, a significant number of insured claims or a claim exceeding the limits of our insurance coverage would harm us by adding further costs to our business and by diverting the attention of our senior management from the operation of our business. Even if we successfully defend a liability claim, the uninsured litigation costs and adverse publicity may be harmful to our business.
Any product liability claim may increase our costs and adversely affect our revenues and operating income. Moreover, liability claims arising from a serious adverse event may increase our costs through higher insurance premiums and deductibles, and may make it more difficult to secure adequate insurance coverage in the future. In addition, our product liability insurance may fail to cover future product liability claims, which, if adversely determined, could subject us to substantial monetary damages.
The efficacy of wellness products is supported by limited conclusive clinical studies, which could result in claims that our wellness products are ineffective or harmful to consumers.
Our wellness products are made from various ingredients including vitamins, minerals, amino acids, herbs, botanicals, fruits, berries and other substances for which there is a long history of human consumption. However, there is little long-term experience with human consumption of certain product ingredients or combinations of ingredients in concentrated form. Although we believe all of our wellness products fall within the generally known safe limits for daily doses of each ingredient contained within them, nutrition science is imperfect. Moreover, some people have peculiar sensitivities or reactions to nutrients commonly found in foods, and may have similar sensitivities or reactions to nutrients contained in our wellness products. Furthermore, nutrition science is subject to change based on new research. New scientific evidence may disprove the efficacy of our wellness products or prove our wellness products to have effects not previously known. We could be adversely affected by studies that may assert that our wellness products are ineffective or harmful to consumers, or if adverse effects are associated with a competitor’s similar products.
TECHNOLOGICAL ADVANCES
We must respond to the rapid changes in technology, services and standards of our industry in order to remain competitive.
The media industry is subject to rapid technological change, evolving industry standards and the emergence of competition from new media technologies and services. We cannot assure you that we will have the resources to acquire new technologies or to introduce new services that could compete with these new technologies. Various new media technologies and services are currently being developed or introduced, including but not limited to:
| • | Satellite-delivered digital audio radio service, which has resulted in the introduction of new subscriber-based satellite radio services with numerous niche formats; |
| 28 |
| • | Audio programming by cable systems, direct-broadcast satellite systems, personal communications systems, content available over the Internet and other digital audio broadcast formats; |
| • | In-band on-channel digital radio, which provides multi-channel, multi-format digital radio services in the same bandwidth currently occupied by traditional AM and FM radio services; |
| • | Low-power FM radio, which could result in additional FM radio broadcast outlets including additional low-power FM radio signals authorized in December 2010 under the Local Community Radio Act; |
| • | High Definition (“HD”) radio; |
| • | Internet radio and other audio content offerings such as Pandora and iHeart Radio; and |
| • | Personal digital audio devices (e.g. audio via WiFi, mobile phones, WiMAX, etc.) or other emerging next-generation networks and technologies. |
We currently program one channel on SiriusXM. We also offer podcasts and downloads of portions of our programming; however, we cannot assure you that this arrangement will be successful or enable us to adapt effectively to these new media technologies. We cannot predict the effect, if any, that competition arising from new technologies or regulatory change(s) may have on the radio broadcast industry or on our financial condition and results of operations.
New technologies may increase competition with our broadcasting and printing operations.
Our broadcasting and printing businesses face increasing competition from new technologies, such as broadband wireless, satellite radio and audio broadcasting by cable television systems, as well as new customer products, such as portable digital audio players and smart mobile phones. These new technologies and alternative media platforms compete with our radio stations for audience share and advertising revenues. The FCC also has approved new technologies for use in the radio broadcasting industry, including the terrestrial delivery of digital audio broadcasting, which significantly enhances the sound quality of radio broadcasts. We are unable to predict the effect that such technologies and related services and products will have on our broadcasting operations, but the capital expenditures necessary to implement such technologies could be substantial. We cannot assure you that we will continue to have the resources to acquire new technologies or to introduce new services to compete with other new technologies or services, and other companies employing such new technologies or services could increase competition with our businesses.
Our printing business also faces increasing competition from the Internet, eBook reader devices, tablets and other new technologies. These new technologies and alternative media platforms compete with our printed books and magazines for audience share and advertising revenues. We must continue to expand our publishing businesses from traditional publishers to new digital technologies. We may make significant investments in new products and services that may not be profitable, or whose profitability may be significantly lower than we have experienced. Success and continued growth depends greatly on developing new products and the means to deliver them in an environment of rapid technological change.
We must respond to changes in consumer behavior as a result of new technologies in order to remain competitive.
Technology, particularly digital technology used in the entertainment industry, continues to evolve rapidly, leading to alternative methods for the delivery and storage of digital content. These technological advancements have driven changes in consumer behavior and have empowered consumers to seek more control over when, where and how they consume digital content. Content owners are increasingly delivering their content directly to consumers over the Internet, often without charge, and innovations in distribution platforms have enabled consumers to view such Internet-delivered content on televisions and portable devices. There is a risk that our responses to these changes and strategies to remain competitive, including distribution of our content on a “pay” basis, may not be adopted by consumers. In publishing, the trend toward digital media may drive down the price consumers are willing to spend on our products disproportionately to the costs associated with generating literary content. Our failure to protect and exploit the value of our content, while responding to and developing new technology and business models to take advantage of advancements in technology and the latest consumer preferences, could have a adversely affect our business, financial condition and results of operations.
INFORMATION TECHNOLOGY, CYBERSECURITY AND OTHER EVENTS
The interruption or failure of our information technology and communications systems, or those of third parties that we rely upon, may adversely affect our business, financial condition, and results of operations.
The availability of our products and services depends on the continuing operation of our information technology and communications systems. Any damage to or failure of our systems, or those of third parties that we rely upon (e.g. co-location providers for data servers, storage devices, and network access) could result in interruptions in our service, which could reduce our revenue and profits. Our systems are also vulnerable to damage or interruption from earthquakes, terrorist attacks, floods, fires, power loss, telecommunications failures, computer viruses or other attempts to harm our systems.
| 29 |
Furthermore, third-party service providers may experience an interruption in operations or cease operations for any reason. If we are unable to agree on satisfactory terms for continued data center hosting relationships, we would be forced to enter into a relationship with other service providers or assume hosting responsibilities ourselves. If we are forced to switch hosting facilities, we may not be successful in finding an alternative service provider on acceptable terms or in hosting the computer servers ourselves. We may also be limited in our remedies against these providers in the event of a failure of service. We also rely on third-party providers for components of our technology platform, such as hardware and software providers. A failure or limitation of service or available capacity by any of these third-party providers may adversely affect our business, financial condition and results of operations.
Our broadcasts often rely on content owned by third parties; obtaining such content could be costly and require us to enter into disadvantageous license or royalty arrangements.
We rely heavily upon content and software owned by third parties in order to provide programming for our broadcasts. The cost of obtaining all necessary licenses and permission to use this third-party content and software continues to increase. Although we attempt to avoid infringing known proprietary rights of third parties in our broadcasting efforts, we expect that we may be subject to legal proceedings and claims for alleged infringement from time to time in the ordinary course of business. Any claims relating to the infringement of third-party proprietary rights, even if not meritorious, could result in costly litigation, divert management’s attention and resources, or require us to enter into royalty or license agreements which are not advantageous to us. In addition, parties making claims may be able to obtain an injunction, which could prevent us from broadcasting all or certain portions of individual radio broadcasts containing content owned by third parties. We also rely on software that we license from third parties, including software that is integrated with internally developed software and used to perform key broadcasting and accounting functions. We could lose the right to use this software or it could be made available to us only on commercially unreasonable terms. Although we believe that alternative software is available from other third-party suppliers or internal developments, the loss of or inability to maintain any of these software licenses or the inability of the third parties to enhance in a timely and cost-effective manner their products in response to changing customer needs, industry standards or technological developments could result in limitations or delays in broadcasting or accounting for programming by us until equivalent software can be developed internally or identified, licensed and integrated, which would harm our business.
We may have difficulty scaling and adapting our existing technology and network infrastructure to accommodate increased traffic and technology advances or changing business requirements, which could lead to the loss of current and potential customers and advertisers, and cause us to incur expenses to make architectural changes.
To be successful, our network infrastructure has to perform well and be reliable. The greater the user traffic and the greater the complexity of our products and services, the more computing power we will need. In the future, we may spend substantial amounts to purchase or lease data centers and equipment, upgrade our technology and network infrastructure to handle increased traffic on our owned and operated websites and roll out new products and services. This expansion could be expensive and complex and could result in inefficiencies or operational failures. If we do not implement this expansion successfully, or if we experience inefficiencies and operational failures during its implementation, the quality of our products and services and our users’ experience could decline. This could damage our reputation and lead us to lose current and potential customers and advertisers. The costs associated with these adjustments to our architecture could harm our operating results. Cost increases, loss of traffic or failure to accommodate new technologies or changing business requirements could harm our business, financial condition and results of operations.
Cybersecurity and privacy breaches may hurt our business, damage our reputation, increase our costs, and cause losses.
We use technology in substantially all aspects of our business operations. Our information technology systems could be subject to invasion, cyber-attack, or data privacy breaches by employees, others with authorized access, and unauthorized persons. Such attacks could result in disruption to our operations, loss or disclosure of, or damage to, our or any of our customer’s or vendor’s data or confidential information. Security measures may also be breached due to employee error, malfeasance, or otherwise. Additionally, outside parties may attempt to fraudulently induce employees, customers or vendors to disclose sensitive information in order to gain access to our data and information technology systems. Any breach could result in significant legal and financial exposure, including damage to our reputation that may affect customer or investor confidence, loss of competitive advantage, a loss of confidence in the security of our information technology systems that could potentially impact our operations, lost revenues resulting from unauthorized use of proprietary information or the failure to retain or attract customers following an attack, and increased cybersecurity protection costs that may include organizational changes, deploying additional personnel and protection technologies, training employees, and engaging third party experts and consultants.
We have preventive systems and processes in place to protect against the risk of cyber incidents. However, the techniques used to obtain unauthorized access and to disable, degrade, or sabotage our information technology systems and websites change frequently and may be difficult to detect for long periods of time. There can be no assurance that we, or the security systems we implement, will protect against all of these rapidly changing techniques. We may be unable to anticipate these techniques or to implement adequate preventive measures. We may incur substantial costs to prevent cyber incidents.
| 30 |
Third parties that provide services for our operations could also be a source of security risk in the event of a failure of their own security systems and infrastructure. In addition, sophisticated hardware and operating system software and applications that are procured from third parties may contain defects in design or manufacture, including “bugs” and other problems that could unexpectedly interfere with the operation of our information technology systems.
Although we have developed systems and processes designed to protect information and prevent data loss and other security breaches, including systems and processes designed to reduce the impact of a security breach, such measures cannot provide absolute security. Breaches, whether successful or unsuccessful, could result in the incurrence of costs related to rebuilding internal systems, defending against litigation, responding to regulatory inquiries or actions, paying damages, and other remediation costs. Remediation costs may include liability for stolen assets or information and incentives to customers or business partners in an effort to maintain the business relationships after an attack.
Global privacy legislation, enforcement, and policy activity are rapidly expanding and creating a complex compliance environment. Our failure to comply with federal, state, or international privacy related or data protection laws and regulations could result in proceedings against us by governmental entities or others. Although we have insurance coverage protecting against cybersecurity risks, it may not be sufficient to cover all possible claims and losses that could have a material adverse effect on our business. Additionally, the nature and extent any future cybersecurity claims may increase our insurance premiums, which could also adversely affect our business.
Our business may be adversely affected by malicious applications that interfere with, or exploit security flaws in, our Internet websites and online services.
Our business may be adversely affected by malicious applications that make changes to our users’ computers and interfere with their experience with our websites. These applications may attempt to change our users’ Internet experience, including hijacking queries to our website, altering or replacing search results or otherwise interfering with our ability to connect with our users. The interference often occurs without disclosure or consent, resulting in a negative experience that users may associate with us. These applications may be difficult or impossible to uninstall or disable, may reinstall themselves and may circumvent other applications’ efforts to block or remove them. The ability to reach users and provide them with a superior experience is critical to our success. If our efforts to combat these malicious applications are unsuccessful, our reputation may be harmed and user traffic could decline, which would damage our business.
Privacy protection is increasingly demanding, and we may be exposed to risks and costs associated with security breaches, data loss, credit card fraud and identity theft that could cause us to incur unexpected expenses and loss of revenue as well as other risks.
The protection of customer, employee, vendor, and other business data is critical to us. Federal, state, provincial and international laws and regulations govern the collection, retention, sharing and security of data that we receive from and about our employees, customers, vendors and franchisees. The regulatory environment surrounding information security and privacy has been increasingly demanding in recent years, and we may see the imposition of new and additional requirements by states and the federal government as well as foreign jurisdictions in which we do business. Compliance with these requirements may result in cost increases due to necessary systems changes and the development of new processes to meet these requirements. In addition, customers have a high expectation that we will adequately protect their personal information. If we or our service providers fail to comply with these laws and regulations or experience a significant breach of customer, employee, vendor, franchisee or other company data, our reputation could be damaged and result in an increase in service charges, suspension of service, lost sales, fines or lawsuits.
The use of credit card payment systems makes us more susceptible to a risk of loss in connection with these issues, particularly with respect to an external security breach of customer information that we or third parties (including those with whom we have strategic alliances) under arrangements with us control. Significant portions of our sales require the collection of certain customer data, such as credit card information. In order for our sales channel to function, we and other parties involved in processing customer transactions must be able to transmit confidential information, including credit card information, securely over public networks. In the event of a security breach, theft, leakage, accidental release or other illegal activity with respect to employee, customer, or vendor with whom we have strategic alliances or other company data, we could become subject to various claims, including those arising out of thefts and fraudulent transactions, and may also result in the suspension of credit card services. This could cause consumers to lose confidence in our security measures, harm our reputation as well as divert management attention and expose us to potentially unreserved claims and litigation. Any loss in connection with these types of claims could be substantial. In addition, if our electronic payment systems are damaged or cease to function properly, we may have to make significant investments to fix or replace them, and we may suffer interruptions in our operations in the interim. In addition, we are reliant on these systems, not only to protect the security of the information stored, but also to appropriately track and record data. Any failures or inadequacies in these systems could expose us to significant unreserved losses, which could materially and adversely affect our business, financial condition and results of operations. Our brand reputation would likely be damaged as well.
| 31 |
Our business is subject to the risks of earthquakes, fires, floods, climate change and other natural catastrophic events and to interruption by man-made problems such as computer viruses or terrorism.
Our systems and operations are vulnerable to damage or interruption from earthquakes, fires, floods, power losses, telecommunications failures, terrorist attacks, acts of war, human errors, break-ins or similar events. A significant natural disaster, such as an earthquake, fire or flood, could adversely affect our business, financial condition and results of operations. Our insurance coverage may be insufficient to compensate us for losses that may occur. Our principal executive offices are located in Southern California, a region known for seismic activity. In addition, acts of terrorism could also cause disruptions in our business or the economy as a whole. We rely heavily on servers, computers, communications systems and the Internet to conduct our business and provide high quality service to our listeners. Our servers may be vulnerable to cybersecurity risks such as computer viruses and break-ins. Disruptions in these services could negatively impact our ability to run our business, result in the loss of existing or potential listeners, the loss of existing or potential advertisers and increase maintenance costs, each of which could adversely affect our business, financial condition and results of operations. To date, we have not experienced significant disruptions in running our business due to catastrophic events, climate change, earthquakes, computer viruses or terrorism. Although we did not incur significant disruptions to our operations, our Houston market was impacted by Hurricane Harvey and our Tampa and Orlando markets were impacted by Hurricane Irma in 2017.
ACQUISITIONS AND CAPITAL INVESTMENTS
We may be unable to integrate the operations and management of acquired stations or businesses, which could adversely affect our business and operating results.
Acquisitions may have a substantial impact on our revenues, costs, cash flows, and financial position. We spent $4.0 million, $10.1 million and $17.3 million on acquisitions during the years ended December 31, 2017, 2016 and 2015, respectively. We expect to make additional acquisitions of radio stations, FM transmitters, digital businesses and publishing businesses. Acquisitions involve risks and uncertainties, including difficulties in integrating acquired operations and in realizing expected opportunities; diversions of management resources and loss of key employees; challenges with respect to operating new businesses; debt incurred in financing such acquisitions; and other unanticipated problems and liabilities. There can be no assurance that we will be able to successfully integrate the operations or management of acquired radio stations and businesses and realize anticipated revenue synergies, or the operations or management of stations and businesses that may be acquired in the future.
Continued acquisitions will require us to manage a larger and likely more geographically diverse region of radio stations, digital portfolios and publishing portfolios than historically has been the case. Our inability to integrate and manage newly-acquired radio stations, digital businesses or publishing entities successfully could adversely affect our business and operating results.
If we are unable to execute our acquisition strategy successfully, our business may not continue to grow.
We intend to continue to selectively acquire radio stations, FM translators, digital media entities and publishing businesses. With respect to the acquisition of radio stations, our acquisition strategy has been, and will continue to focus primarily on, the acquisition of stations in the top fifty (50) markets. However, we may not be able to identify and consummate future acquisitions successfully, and stations that we do acquire may not increase our station operating income or yield other anticipated benefits. Acquisitions in markets in which we already own stations may not increase our station operating income due to saturation of audience demand. Acquisitions in smaller markets may have less potential to increase operating revenues. With respect to our acquisition strategy of digital and publishing businesses, we may not be able to identify and consummate the acquisition of future businesses successfully. Additionally, we may not be able to effectively integrate the operation of newly-acquired businesses with our existing businesses, which could result in reduced operating income from our businesses. Our failure to execute our acquisition strategy successfully in the future could limit our ability to continue to grow in terms of number of stations or profitability.
Some of our acquisition agreements contain contingent earn-out consideration, the value of which may impact future operating results.
Some of our acquisition agreements include contingent earn-out consideration, the fair value of which is estimated as of the acquisition date based on the present value of the expected contingent payments as determined using weighted probabilities of possible future payments. These fair value estimates contain unobservable inputs and estimates that could materially differ from the actual future results. The fair value of the contingent earn-out consideration could increase or decrease, up to the contracted limit, as applicable. Changes in the fair value of contingent earn-outs will be reflected in our results of operations in the period in which they are recognized, the amount of which may be material and cause volatility in our operating results.
| 32 |
If we are unable to implement our market cluster strategy, we may not realize anticipated operating efficiencies.
As part of our operating strategy, we attempt to realize efficiencies in operating costs and cross-selling of advertising by clustering the operations of two or more radio stations in a single market. However, there can be no assurance that this operating strategy will be successful. Furthermore, we cannot make any assurance that the clustering of radio stations in one market will not result in downward pressure on advertising rates at one or more of the existing or new radio stations within the cluster. Furthermore, there can be no assurance that any of our stations will be able to maintain or increase its current listening audiences and operating revenue in circumstances where we implement our clustering strategy.
Additionally, FCC rules and policies allow a broadcaster to own a number of radio stations in a given market and permit, within limits, joint arrangements with other stations in a market relating to programming, advertising sales and station operations. We believe that radio stations that elect to take advantage of these clustering opportunities may have lower operating costs and may be able to offer advertisers more attractive rates and services. The future development of our business in new markets, as well as the maintenance of our business growth in those markets in which we do not currently have radio station clusters, may be negatively impacted by competitors who are taking or may take advantage of these clustering opportunities by operating multiple radio stations within markets.
We base capital allocation decisions primarily on our analysis of the predicted internal rate of return. If the estimates and assumptions we use in calculating the internal rate of return are inaccurate, our capital may be inefficiently allocated. If we fail to appropriately allocate our capital, our growth rate and financial results may be adversely affected.
We continually seek opportunities for growth by increasing the strength and number of our broadcast signals, increasing the number of page views on our web platform and increasing the subscriber base of our publications. In order to realize these growth opportunities, we must rely on continued technical improvements to expand our broadcasting, digital and publication footprint. When deciding which opportunities to pursue, we must predict the internal rate of return associated with each project. Our calculations are based on certain estimates and assumptions that may not be realized. Accordingly, the calculation of internal rate of return may not be reflective of our actual returns, and our capital may be inefficiently allocated. If we fail to appropriately allocate our capital, our growth rate and financial results could be adversely affected.
Our syndicated programming is dependent upon maintenance of our transponder equipment, which is located at various customer sites.
Delivery of our national programs is dependent upon transponder equipment that is located at various customer locations. The quality and durability of this equipment, as well as our ability to protect the equipment from damage, destruction or theft, directly impacts our ability to transmit programming. Losses to this equipment and any business interruption may not be fully insurable.
If we are unable to protect our domain names, our reputation and brands could be adversely affected.
We currently hold various domain name registrations relating to our brands. The registration and maintenance of domain names generally are regulated by governmental agencies and their designees. Governing bodies may establish additional top-level domains, appoint additional domain name registrars or modify the requirements for holding domain names. As a result, we may be unable to register or maintain relevant domain names. We may be unable, without significant cost or at all, to prevent third parties from registering domain names that are similar to, infringe upon or otherwise decrease the value of, our trademarks and other proprietary rights. Failure to protect our domain names could adversely affect our reputation and brands, and make it more difficult for users to find our websites and our services.
Impairment of FCC licenses, goodwill and other intangible assets deemed to have indefinite useful lives could cause future losses due to asset impairment.
A majority of the purchase price for broadcast stations is allocated to FCC licenses. We may also record goodwill based on our acquisition activity. Approximately 71% of our total assets at December 31, 2017 consisted of indefinite-lived intangible assets including broadcast licenses, goodwill and mastheads. The value of these indefinite-lived intangible assets depends significantly upon the operating results of our businesses. We do not amortize goodwill or other indefinite-lived intangible assets, but rather test for impairment at least annually or more frequently if events or circumstances indicate that an asset may be impaired.
We perform our annual impairment testing during the fourth quarter of each year, which coincides with our budget and planning process for the upcoming year. We have incurred significant impairment losses in prior years with regard to our indefinite-lived intangible assets.
The valuation of intangible assets is subjective and based on estimates rather than precise calculations. The fair value measurements of our indefinite-lived intangible assets use significant unobservable inputs that reflect our own assumptions about the estimates that market participants would use in measuring fair value including assumptions about risk. If actual future results are less favorable than the assumptions and estimates we used, we are subject to future impairment charges, the amount of which may be material. Given the current economic environment and uncertainties that can negatively impact our business, there can be no assurance that our estimates and assumptions made for the purpose of our indefinite-lived intangible fair value estimates will prove to be accurate.
| 33 |
There were no impairments recognized during our annual testing in the fourth quarter of 2017. Due to operating results that did not meet management’s expectations, we ceased publishing Preaching Magazine™, YouthWorker Journal™, FaithTalk Magazine™ and Homecoming™ The Magazine upon issuance of the May 2017 publication. Because of the likelihood that these print magazines would be sold or otherwise disposed of before the end of their previously estimated life, we performed impairment tests as of March 31, 2017. Due to reductions in forecasted operating cash flows and indications of interest from potential buyers, we then recorded an impairment charge of $19,000 associated with mastheads.
We recognized a $7.0 million impairment charge during our annual testing in the fourth quarter of 2016 of which $6.5 million related to impairments of broadcast licenses and $0.5 million related to impairment of mastheads. Broadcast licenses were deemed to be impaired in our Cleveland, Dallas, Detroit and Portland market clusters due to an increase in the risk-adjusted discount rate or Weighted Average Cost of Capital (“WACC”). Mastheads were deemed to be impaired due to further reductions in projected net revenues and increases in the WACC.
We recognized a $0.4 million impairment charge during our annual testing in the fourth quarter of 2015 associated with the value of goodwill in our Singing News Network due to a reduction in projected net revenues.
While the impairment charges we have recognized are non-cash in nature and did not violate the covenants on the then existing Revolver and Term Loan B, the potential for future impairment charges can be viewed as a negative factor with regard to forecasted future performance and cash flows. We believe that we have adequately considered the potential for an economic downturn in our valuation models and do not believe that the non-cash impairments in and of themselves are a liquidity risk.
FINANCIAL REPORTING
The requirements of being a public company may strain our resources and divert management’s attention.
We are subject to the reporting requirements of the Exchange Act, the listing requirements of the NASDAQ Global Select Market, and other applicable securities rules and regulations. Compliance with these rules and regulations results in a higher level of legal and financial compliance costs. Compliance can divert the time and attention of management from revenue-generating activities. Moreover, because these laws, regulations and standards are subject to varying interpretations, their application in practice may evolve over time as new guidance becomes available. This evolution may result in continuing uncertainty regarding compliance matters and additional costs necessitated by ongoing revisions to our disclosure and governance practices. If we fail to address and comply with these regulations and any subsequent changes, our business and operating results may be harmed.
In addition, complying with public disclosure rules makes our business more visible, which we believe may result in threatened or actual litigation, including by competitors and other third parties. If such claims are successful, our business and operating results could be harmed, and even if the claims do not result in litigation or are resolved in our favor, these claims, and the time and resources necessary to resolve them, could divert the resources of our management and harm our business and operating results.
If we are unable to maintain effective internal control over financial reporting in the future, investors may lose confidence in the accuracy and completeness of our financial reports and the trading price of our Class A common stock may be negatively affected.
We are subject to Section 404 of the Sarbanes-Oxley Act (SOX), which requires us to maintain internal control over financial reporting and to report any material weaknesses in such internal controls. We have consumed and will continue to consume management resources and incur expenses for SOX compliance on an ongoing basis. If we identify material weaknesses in our internal control over financial reporting, or if we are unable to comply with the requirements of Section 404 in a timely manner or assert that our internal control over financial reporting is effective, investors may lose confidence in the accuracy and completeness of our financial reports and the trading price of our Class A common stock could be negatively affected. Additionally, we could become subject to investigations by the stock exchange on which our securities are listed, the SEC, or other regulatory authorities, which could require additional financial and management resources.
| 34 |
WELLNESS PRODUCTS
We are currently dependent on a limited number of independent suppliers and manufacturers of our wellness products, which may affect our ability to deliver our wellness products in a timely manner. If we are not able to ensure timely product deliveries, potential distributors and customers may not order our wellness products, and our revenues may decrease.
We rely entirely on a limited number of third parties to supply and manufacture our wellness products. These third parties are subject to FDA regulation and must operate in accordance with strict manufacturing requirements referred to as Current Good Manufacturing Practices (“CGMP’s”) for dietary supplements. Our wellness products are manufactured on a purchase order basis only and manufacturers can terminate their relationships with us at any time. These third party manufacturers may be unable to satisfy our supply requirements, manufacture our wellness products on a timely basis and in compliance with CGMP’s, fill and ship our orders promptly, provide services at competitive costs or offer reliable products and services. The failure to meet any of these critical needs and legal requirements would delay or reduce wellness product shipments and adversely affect our revenues, as well as jeopardize our relationships with our customers. If any of our third party manufacturers were to become unable or unwilling to continue to provide us with products in required volumes and at suitable quality levels, we would be required to identify and obtain acceptable replacement manufacturing sources. We cannot assure you that we would be able to obtain alternative manufacturing sources on a timely basis. Additionally, all of our third party manufacturers source the raw materials for our products, and if we were to use alternative manufacturers, we may not be able to duplicate the exact taste and consistency profile of the product from the original manufacturer. An extended interruption in the supply of our products would result in decreased product sales and our revenues would likely decline. We believe that we can meet our current supply and manufacturing requirements with our current suppliers and manufacturers or with available substitute suppliers and manufacturers.
We are dependent on our third party manufacturers to supply our wellness products in the compositions we require, and we do not independently analyze our wellness products. Any errors in our wellness product manufacturing could result in wellness product recalls, contamination, significant legal exposure, reduced revenues and the loss of distributors.
While we require that our manufacturers verify the accuracy of the contents of our wellness products, we do not have the expertise or personnel to monitor the production of products by these third parties. We rely exclusively, without independent verification, on certificates of analysis regarding wellness product content provided by our third party suppliers and limited safety testing they perform. We cannot be assured that all of the third parties involved in the manufacturing of our products are complying with government health and safety standards, and even if our wellness products meet these standards, they could otherwise become contaminated. Errors in the manufacture of our wellness products and the occurrence of contamination could result in product recalls, significant legal exposure, adverse publicity, decreased revenues and loss of distributors and endorsers. We also cannot be assured that these outside manufacturers will continue to supply wellness products to us reliably in the compositions we require. Any of these failures or occurrences could negatively affect our wellness products business and financial performance.
If the wellness products we sell do not have the healthful effects intended, our wellness products business may suffer.
In general, our wellness products sold consist of nutritional supplements, which are classified in the United States as “dietary supplements” which do not currently require approval from the FDA or other regulatory agencies prior to sale. Although many of the ingredients in such wellness products are vitamins, minerals, herbs and other substances for which there is a long history of human consumption, they contain innovative ingredients or combinations of ingredients. Although we believe all of such wellness products and the combinations of ingredients in them are safe when taken as directed, there is little long-term experience with human or other animal consumption of certain of these ingredients or combinations thereof in concentrated form. The wellness products could have certain side effects if not taken as directed or if taken by a consumer that has certain medical conditions. Furthermore, there can be no assurance that any of the wellness products, even when used as directed, will have the effects intended or will not have harmful side effects.
RISKS ASSOCIATED WITH REGULATIONS
If we fail to maintain our broadcast licenses with the FCC, we would be prevented from operating affected radio stations.
We operate each of our radio stations pursuant to one or more FCC broadcast licenses, generally of eight years’ duration. As each license expires, we apply for renewal of the license. However, we cannot be sure that any of our licenses will be renewed, and renewal is subject to challenge by third parties or to denial by the FCC. In evaluating a broadcast license renewal application, the FCC must grant the renewal if: (1) the station has served the public interest, convenience and necessity; (2) there have been no serious violations of the Communications Act or the FCC’s rules; and (3) there have been no other violations which, taken together, constitute a pattern of abuse. If, however, the station fails to meet these standards, the FCC may deny the application, after notice and an opportunity for a hearing, or grant the application on terms and conditions that are appropriate, including renewal for less than the maximum term otherwise allowed. The failure to renew any of our licenses would prevent us from operating the affected station and generating revenue from it. If the FCC decides to include conditions or qualifications in any of our licenses, we may be limited in the manner in which we may operate the affected station.
| 35 |
The restrictions on ownership of multiple radio stations in each market may prevent us from implementing our broadcasting market cluster strategy.
We seek to acquire additional radio stations in markets in which we already have existing stations. Our ability to acquire, operate and integrate any such future acquisitions as part of a cluster is limited by antitrust laws, the Communications Act, FCC regulations and other applicable laws and regulations. Changes to any of these laws or regulations may affect our ability to acquire additional stations in radio markets where we already own one (1) or more radio station(s). In 1996, Congress passed legislation that requires the FCC to periodically conduct reviews of its regulations, including those which govern the maximum number of radio stations an entity may own or have joint arrangements with relating to programming, advertising sales and station operations (the “Ownership Limits”). The FCC has adopted radio multiple ownership rules that depend upon the total number of radio stations located in the market in determining the applicable Ownership Limits. In 2003, the FCC modified its definition of the term “market” and its method of determining the number of radio stations located in a “market.” Specifically, in larger markets, the FCC replaced its “signal contour method” of defining a market and determining the number of radio stations located in the market with the use of “geographic markets” delineated by Nielsen, which is a commercial ratings service, as reported in the BIA database, as issued by BIA/Kelsey, a research and advisory company focused on the local advertising marketplace. For smaller radio markets for which Nielsen has not delineated a geographic market, the “signal contour method” continues to be the method of defining the market and determining the number of radio stations in the market. The methods the FCC uses to define markets affect the number of radio stations an entity may own or have joint arrangements with relating to programming, advertising sales and station operations in areas adjacent to a delineated Nielsen market.
In 2010, the FCC opened a new phase of rulemaking concerning its broadcast ownership rules. The FCC sought public comments on the existing rules, including arguments and factual data on their impact on competition, localism, and diversity and held public meetings around the country on the issue of media ownership rules. The FCC 2010 quadrennial review of broadcast ownership rules was consolidated into the FCC’s 2014 quadrennial review of broadcast ownership rules, which commenced in spring of 2014. The local radio ownership rule, the radio/television cross-ownership rule and newspaper/broadcast cross-ownership rule are among the broadcast ownership rules considered in the 2010 and 2014 quadrennial reviews. The FCC instructed its Media Bureau to complete the combined 2010 and 2014 reviews by June 30, 2016. On August 25, 2016, the FCC released a Second Report and Order to close the 2010 and 2014 Quadrennial Review proceedings. The FCC decided to retain its local radio ownership rules without modification. In November 2017, the FCC adopted an Order on Reconsideration of the 2nd R & O (“Reconsideration Order”), which repealed the Newspaper/Broadcast Cross-Ownership Rule, the Radio/Television Cross-Ownership Rule, and the attribution rule for television joint sales agreements. The Reconsideration Order also revised the Local Television Ownership Rule to eliminate the Eight-Voices Test and modified the Top-Four Prohibition. The Reconsideration Order largely retained the local radio ownership rules, but adopted a presumptive waiver approach for existing parent markets with multiple embedded markets. While still the subject of appeals, the Third Circuit denied a request for stay of the Reconsideration Order and many of the rule changes adopted therein have now gone into effect. As noted above, the Reconsideration Order largely retained the local radio ownership rules. It is anticipated, however, that the FCC will initiate the 2018 Quadrennial Review proceedings in the near future and could propose changes to the local radio ownership rules.
We cannot predict the impact of possible modifications to the FCC’s local radio multiple ownership rules on our business operations. Likewise, we cannot predict whether there will be a change in the antitrust laws, Communications Act or other laws governing the ownership or operation of radio stations, or whether the FCC, U.S. Department of Justice (“DOJ”) or Federal Trade Commission (“FTC”) will modify their regulations and policies governing or affecting the acquisition of additional radio stations in a market. In addition, we cannot predict whether a private party will challenge acquisitions we propose in the future. These events could adversely affect our ability to implement our cluster acquisition strategy.
Government regulation of the broadcasting industry by the FTC, DOJ and FCC may limit our ability to acquire or dispose of radio stations and enter into certain agreements.
The Communications Act and FCC rules and policies require prior FCC approval for transfers of control of, and assignments of, FCC broadcast licenses. The FTC and the DOJ evaluate transactions to determine whether those transactions should be challenged under federal antitrust laws. As we have gained a presence in a greater number of markets and percentage of the top 50 markets, our future proposed transactions may be subject to more frequent and aggressive review by the FTC and/or the DOJ due to market concentration concerns. This increased level of review may be accentuated in instances where we propose to engage in a transaction with parties who themselves have multiple stations in the relevant market. The FCC might not approve a proposed radio station acquisition or disposition when the DOJ has expressed market concentration concerns with respect to the buy or sell side of a given transaction, even if the proposed transaction would otherwise comply with the FCC’s numerical limits on in-market ownership. We cannot be sure that the DOJ or the FTC will not seek to prohibit or require the restructuring of our future acquisitions or dispositions on these or other bases.
If a complaint was filed against us or other FCC licensees involved in a transaction with us, or an objection to the transaction itself, the FCC could delay the grant of, or refuse to grant, its consent to an assignment or transfer of control of licenses and effectively prohibit a proposed acquisition or disposition.
As noted in the immediately preceding risk factor, the FCC’s local radio multiple ownership rules limit the maximum number of stations we may own or operate in a market. This may limit our ability to make future radio station acquisitions in certain markets. Additionally, this may limit our ability, in certain markets, to enter into agreements whereby we provide programming to or sell advertising on radio stations that we do not own. It could also limit our ability to sell stations to other entities that already own stations in some markets.
| 36 |
Proposed legislation requires radio broadcasters to pay higher royalties to record labels and recording artists.
We must maintain music programming royalty arrangements with, and pay license fees to, owners of rights in musical works. Traditionally, Broadcast Music, Inc. (“BMI”), American Society of Composers, Authors and Publishers (“ASCAP”), and SESAC, Inc. (“SESAC”) have negotiated for these copyright users, collected royalties and distributed them to songwriters and music publishers. These traditional arrangements are changing. Owners of rights in musical works have withdrawn from BMI, ASCAP and SESAC and new entities, such as GMR, have been formed to represent owners of musical works. In addition, Committees of Congress have held hearings on substantial revisions of the Copyright Act. The fracturing of the traditional system for licensing rights in musical works may have significant consequences to our business, including increasing licensing costs and reducing the availability of certain pieces for use on our services.
On March 30, 2017, legislation was introduced to Congress under the “Fair Play, Fair Pay Act” (H.R. 1836 – 115th Congress) that would require terrestrial radio broadcasters to pay a royalty to record labels and performing artists for use of their recorded songs. The proposed legislation would add an additional layer of royalties to be paid directly to the record labels and artists. As of the date of this report, this bill has not been passed. It is currently unknown what proposed legislation, if any, will become law, and what significance this royalty would have on our results from operations, cash flows or financial position.
Changes in regulations or user concerns regarding privacy and protection of user data, or any failure to comply with such laws, could diminish the value of our services and cause us to lose customers and revenue.
When a user visits our websites or certain pages of our customers’ websites, we use technologies, including “cookies,” to collect information related to the user, such as the user’s Internet Protocol, or IP, address, demographic information, and history of the user’s interactions with advertisements previously delivered by us. The information that we collect about users helps us deliver appropriate content and targeted advertising to the users. A variety of federal, state and international laws and regulations govern the collection, use, retention, sharing and security of data that we receive from and about our users. The existing privacy-related laws and regulations are evolving and subject to potentially differing interpretations. We post privacy policies on all of our owned and operated websites that set forth our policies and practices related to the collection and use of customer data. Any failure, or perceived failure, by us to comply with our posted privacy policies or with industry standards or laws or regulations could result in a loss of customer confidence in us, or result in actions against us by governmental entities or others, all of which could potentially cause us to lose customers and revenues.
In addition, various federal, state and foreign legislative and regulatory bodies may expand current or enact new laws regarding privacy matters. New laws may be enacted, or existing laws may be amended or re-interpreted, in a manner that limits our ability to analyze user data. If our access to user data is limited through legislation or any industry development, we may be unable to provide effective technologies and services to customers and we may lose customers and revenue.
Certain U.S. and foreign laws could subject us to claims or otherwise harm our business.
We are subject to a variety of laws in the U.S. and abroad that may subject us to claims or other remedies. Our failure to comply with applicable laws may subject us to additional liabilities, which could adversely affect our business, financial condition and results of operations. In addition to laws and regulations that are described elsewhere in the risk factors, laws and regulations that are particularly relevant to our business address (a) privacy; (b) freedom of expression; (c) information security; (d) content and distribution of content, including liability for user reliance on such content; I intellectual property rights, including secondary liability for infringement by others; (f) domain name registration; and (g) online advertising and marketing, including email marketing and unsolicited commercial email.
Many applicable laws were adopted prior to the advent of the Internet and do not contemplate or address the unique issues of the Internet. Moreover, the applicability and scope of the laws that do address the Internet remain uncertain. For example, the laws relating to the liability of providers of online services are evolving. Claims have been either threatened or filed against us under both U.S. and foreign laws for defamation, copyright infringement and trademark infringement. In the future, claims may also be alleged against us based on tort claims and other theories based on our content, products and services or content generated by our users.
We receive, process and store large amounts of personal user data on our owned and operated websites and from our freelance content creators. Our privacy and data security policies govern the collection, use, sharing, disclosure and protection of this data. The storing, sharing, use, disclosure and protection of personal information and user data are subject to federal, state and international privacy laws, the purpose of which is to protect the privacy of personal information that is collected, processed and transmitted in or from the governing jurisdiction. If requirements regarding the manner in which certain personal information and other user data are processed and stored change significantly, our business may be adversely affected, impacting our financial condition and results of operations. In addition, we may be exposed to potential liabilities as a result of differing views on the level of privacy required for customer and other user data we collect. Our failure or the failure of various third-party vendors and service providers to comply with applicable privacy policies or applicable laws and regulations or any compromise of security that results in the unauthorized release of personal information or other user data could adversely affect our business, financial condition and results of operations.
| 37 |
Government regulation of the Internet is evolving, and unfavorable developments could adversely affect our operating results.
We are subject to general business regulations and laws, as well as regulations and laws specific to the Internet. Such laws and regulations cover taxation, user privacy, data collection and protection, copyrights, electronic contracts, sales procedures, automatic subscription renewals, credit card processing procedures, customer protections, broadband Internet access and content restrictions. We cannot guarantee that we have been or will be fully compliant in every jurisdiction, as it is not entirely clear how existing laws and regulations governing issues such as privacy, taxation and consumer protection apply to the Internet. Moreover, as Internet commerce continues to evolve, increasing regulation by federal, state and foreign agencies becomes more likely. The adoption of any laws or regulations that adversely affect the popularity or growth in use of the Internet, including laws limiting Internet neutrality, could decrease listener demand for our service offerings and increase our cost of doing business. Future regulations, or changes in laws and regulations or their existing interpretations or applications, could also hinder our operational flexibility, raise compliance costs and result in additional historical or future liabilities for us, adversely impacting our business and our operating results.
We are affected by extensive laws, governmental regulations, administrative determinations, court decisions and similar constraints, which can make compliance for our wellness business costly and subject us to enforcement actions by governmental agencies.
The processing, formulation, safety, manufacturing, packaging, labeling, advertising and distribution of our wellness products are subject to federal laws and regulation by one or more federal agencies, including the FDA, FTC, U.S. Consumer Product Safety Commission, United States Department of Agriculture and Environmental Protection Agency. These activities are also regulated by various state, local and international laws and agencies of the states and localities in which our wellness products are sold. Government regulations may prevent or delay the introduction, or require the reformulation, of our wellness products, which could result in lost revenues and increased costs to us. For instance, the FDA regulates, among other things, the composition, safety, manufacture, labeling and marketing of dietary supplements (including vitamins, minerals, herbs, and other dietary ingredients for human use). The FDA may not accept the evidence of safety for any new dietary ingredient that we may wish to market, may determine that a particular dietary supplement or ingredient presents an unacceptable health risk based on the required submission of serious adverse events or other information, and may determine that a particular claim or statement of nutritional value that we use to support the marketing of a dietary supplement is an impermissible drug claim, is not substantiated, or is an unauthorized version of a “health claim.”
Any of these actions could prevent us from marketing particular wellness products or making certain claims or statements with respect to those wellness products. The FDA could also require us to remove a particular wellness product from the market. Any future recall or removal would result in additional costs to us, including lost revenues from any wellness product that we are required to remove from the market, any of which could be material. Any wellness product recalls or removals could also lead to an increased risk of litigation and liability, substantial costs, and reduced growth prospects.
Additional or more stringent laws and regulations of dietary supplements and other wellness products have been considered from time to time. These developments could require reformulation of some wellness products to meet new standards, recalls or discontinuance of some wellness products not able to be reformulated, additional record-keeping requirements, increased documentation of the properties of some wellness products, additional or different labeling, additional scientific substantiation, or other new requirements. Any of these developments could increase our costs significantly.
Our failure to comply with FTC regulations could result in substantial monetary penalties and could adversely affect our business, financial condition and results of operations.
The FTC exercises jurisdiction over the advertising of wellness products and has instituted numerous enforcement actions against dietary supplement companies for failure to have adequate substantiation for claims made in advertising or for the use of false or misleading advertising claims. Our failure to comply with FTC regulations could result in substantial monetary penalties and could adversely affect our business, financial condition and results of operations.
We may be adversely affected by statutes dealing with indecency.
The Broadcast Decency Enforcement Act of 2005 enhances the FCC’s enforcement of its rules concerning the broadcast of obscene, indecent, or profane material became law in 2006. This legislation increased the FCC’s authority in this area to impose substantially higher monetary forfeiture penalties, up to $325,000 per violation and a total of $3,000,000 for any one incident. While we do not anticipate these increased penalties to impact us as significantly as some of our competitors given the nature of our programming, we could face increased costs in the form of fines as a result of this legislation.
| 38 |
We may be subject to fines and other penalties related to violations of FCC indecency rules and other FCC rules and policies, the enforcement of which has increased in recent years, and complaints related to such violations may delay our renewal applications with the FCC.
We provide live news reporting that is controlled by our on-air news talent. Although our on-air talent have been professional and careful in what they say, there is always the possibility that information may be reported that is inaccurate or even in violation of certain indecency rules promulgated by the FCC.
Environmental, health, safety and land use laws and regulations may limit or restrict some of our operations.
We must comply with various federal, state and local environmental, health, safety and land use laws and regulations that have a tendency to affect broadcast facilities differently than other uses. We are subject to such laws and regulations relating to the use, storage, disposal, emission and release of hazardous and non-hazardous substances and employee health and safety, as well as zoning restrictions that may affect, among other things, the ability for us to improve or relocate our radio broadcasting facilities. Historically, we have not incurred significant expenditures to comply with these laws; however, existing laws, and those that may be applied in the future, or a finding of a violation of such laws or liability, could require us to make significant expenditures and otherwise limit or restrict some of our operations.
RISKS ASSOCIATED WITH OUR SUBSTANTIAL INDEBTEDNESS
Capital requirements necessary to implement acquisitions could pose risks.
We face competition from other companies for acquisition opportunities. If the prices sought by sellers of these companies were to rise, we may find fewer acceptable acquisition opportunities. In addition, the purchase price of possible acquisitions could require additional debt or equity financing on our part. Since the terms and availability of this financing depend to a large degree upon general economic conditions and third parties over which we have no control, we can give no assurance that we will obtain the needed financing or that we will obtain such financing on attractive terms. In addition, our ability to obtain financing depends on a number of other factors, many of which are also beyond our control, such as interest rates and national and local business conditions. If the cost of obtaining needed financing is too high or the terms of such financing are otherwise unacceptable in relation to the acquisition opportunity we are presented with, we may decide to forego that opportunity. Additional indebtedness could increase our leverage and make us more vulnerable to economic downturns and may limit our ability to withstand competitive pressures.
If we are not able to obtain financing or generate sufficient cash flows from operations, we may be unable to fund future acquisitions.
We may require significant financing to fund our acquisition strategy, which may not be available to us. The availability of funds under the Asset Based Revolving Credit Facility (“ABL Facility”) at any time will depend upon, among other factors, our ability to satisfy financial covenants and borrowing base requirements. Our future operating performance will be subject to financial, economic, business, competitive, regulatory and other factors, many of which are beyond our control. Accordingly, we cannot make any assurances that our future cash flows or borrowing capacity will be sufficient to allow us to complete future acquisitions or implement our business plan, which could have a material negative impact on our business and results of operations.
We have substantial debt and have the ability to incur additional debt. The principal and interest payment obligations of such debt may restrict our future operations and impair our ability to meet our obligations under such debt.
At December 31, 2017, we and our subsidiary guarantors had approximately $264.0 million aggregate principal amount of outstanding indebtedness, all of which is senior debt comprised of an aggregate principal amount of $255.0 million outstanding on our 6.75% Senior Secured Notes (“Notes”) and $9.0 million on our ABL Facility effectively ranking senior to the Notes to the extent of the ABL Priority Collateral securing such debt. In addition, the terms of the ABL Facility and the Indenture governing the Notes permit us to incur additional indebtedness, including up to approximately $21.0 million that would be available under the ABL Facility, subject to our ability to meet certain borrowing conditions.
Our substantial debt may have important consequences. For instance, it could:
| • | require us to dedicate a substantial portion of any cash flow from operations to the payment of interest and principal due under our debt, which will reduce funds available for other business purposes, including capital expenditures, acquisitions and payment of dividends; |
| • | place us at a competitive disadvantage compared with some of our competitors that may have less debt and better access to capital resources; and |
| • | limit our ability to obtain additional financing required to fund working capital and capital expenditures and for other general corporate purposes. |
Our ability to satisfy our obligations and to reduce our total debt depends on our future operating performance and on economic, financial, competitive and other factors, many of which are beyond our control. Our business may not generate sufficient cash flow, and future financings may not be available to provide sufficient net proceeds, to meet these obligations or to successfully execute our business or acquisition strategies.
| 39 |
The agreements governing our various debt obligations impose restrictions on our business and could adversely affect our ability to undertake certain corporate actions.
The agreements governing our debt obligations, including the Indenture governing the Notes and the agreements governing the ABL Facility, include covenants imposing significant restrictions on our business. These restrictions may affect our ability to operate our business and may limit our ability to take advantage of potential business opportunities as they arise. These covenants place restrictions on our ability to, among other things:
| • | incur additional debt; |
| • | declare or pay dividends, redeem stock or make other equity distributions to stockholders; |
| • | make investments; |
| • | create liens or use assets as security in other transactions; |
| • | merge or consolidate, or sell, transfer, lease or dispose of all or substantially all of our assets; |
| • | engage in transactions with affiliates; and |
| • | sell or transfer assets. |
The ABL Facility also requires us to comply with a number of financial ratios, borrowing base requirements and covenants and restricts our ability to make certain capital expenditures.
Our ability to comply with these covenants may be affected by events beyond our control, including prevailing economic, financial and industry conditions. These covenants could adversely affect our business by limiting our ability to take advantage of financing, merger and acquisition or other corporate opportunities. The breach of any of these covenants or restrictions could result in a default under the Indenture governing the Notes or the ABL Facility. An event of default under any of our debt agreements could permit some of our lenders, including the lenders under the ABL Facility, to declare all amounts borrowed from them to be immediately due and payable, together with accrued and unpaid interest, which could, in turn, trigger defaults under other debt obligations and the commitments of the lenders to make further extensions of credit under the ABL Facility could be terminated. If we were unable to repay debt to our lenders, or are otherwise in default under any provision governing our secured debt obligations, our secured lenders could proceed against us and our subsidiary guarantors and against the collateral securing that debt. In addition, acceleration of our other indebtedness may cause us to be unable to make interest payments on the Notes and repay the principal amount of or repurchase the Notes or may cause or subsidiary guarantors to be unable to make payments under the guarantees.
To service our indebtedness, we will require a significant amount of cash. However, our ability to generate cash depends on many factors beyond our control.
Our ability to make payments on, and to refinance, our indebtedness and to fund capital expenditures, will depend on our ability to generate cash in the future, which, in turn, is subject to general economic, financial, competitive, regulatory and other factors, many of which are beyond our control.
Our business may not generate sufficient cash flow from operations, and we may not have available to us future borrowings in an amount sufficient to enable us to pay our indebtedness or to fund our other liquidity needs. In these circumstances, we may need to refinance all or a portion of our indebtedness on or before maturity. We may not be able to refinance any of our indebtedness, including the ABL Facility and the Notes, on commercially reasonable terms, or at all. Without this financing, we could be forced to sell assets or secure additional financing to make up for any shortfall in our payment obligations under unfavorable circumstances. However, we may not be able to secure additional financing on terms favorable to us or at all and, in addition, the terms of the ABL Facility and the Indenture governing the Notes limit our ability to sell assets and also restrict the use of proceeds from such a sale. In addition, we may not be able to sell assets quickly enough or for sufficient amounts to enable us to meet our obligations.
ITEM 1B. UNRESOLVED STAFF COMMENTS.
None.
We own or lease various properties throughout the United States from which we conduct business. No one physical property is material to our overall business operations. We believe that each of our properties are in good condition and suitable for our operations; however, we continually evaluate opportunities to upgrade our properties. We believe that we will be able to renew existing leases when applicable or obtain comparable facilities, as necessary.
| 40 |
Corporate
Our corporate headquarters are located in Camarillo, California where we own an approximately 46,000 square foot office building.
Broadcasting
We own or lease multiple properties throughout the United States from which we operate our radio stations and related facilities. These properties include offices and studios, transmitter locations, antenna sites and tower sites. A radio station studio is typically located in an office in a downtown or business district. Transmitter, antenna and tower sites are located in areas that provide maximum market coverage.
Our SRN and SMR offices, Salem Consumer Products, and our Dallas radio station studios and offices are located in the Dallas, Texas metropolitan area, where we own an approximately 43,000 square foot office building. We also own office buildings in Honolulu, Hawaii; Tampa, Florida; and Orlando, Florida from which our radio stations studios and offices operate. Our national radio network operates from various offices and studios. These studios may be used to generate programming or programming can also be relayed from a remote point of origination. Our network leases satellite transponders used in the delivery of its programming.
We lease certain property from our principal stockholders or trusts and partnerships created for the benefit of the principal stockholders and their families. These leases are described in Note 16 – Related Party Transactions in the notes to our Consolidated Financial Statements contained in Item 8 of this annual report on Form 10-K. All such leases have cost of living adjustments. Based upon our management’s assessment and analysis of local market conditions for comparable properties, we believe such leases have terms that are as favorable as, or more favorable, to the company than those that would have been available from unaffiliated parties.
Our current lease agreements range from one to twenty years remaining on the lease term.
While none of our owned or leased properties is individually material to our operations, if we were required to relocate any of our broadcast towers, the cost would be significant. Significant costs are due to the moving and reconstruction of the tower as well as the limited number of sites in any geographic area that permit a tower of reasonable height to provide adequate market coverage. These limitations are due to zoning and other land use restrictions, as well as Federal Aviation Administration and FCC regulations.
Digital Media
Our digital media entities operate from office buildings and also require data storage centers. Salem Web Network operates from leased office facilities in Richmond, Virginia and Nashville, Tennessee. Townhall Media operates from a leased facility in Washington D.C. that is also used by our radio stations in that market. Eagle Financial Publications operates from a leased office in Washington D.C. that is shared with our Eagle Wellness employees. Fulfillment of wellness inventory is managed by a third party in New Holland, Pennsylvania. Our current lease agreements range from one to nine years remaining on the lease term.
Publishing
Singing News® magazine, previously Salem Publishing™ operates from leased office facilities in Nashville, Tennessee. Salem Author Services operates from leased facilities in Orlando, Florida. Regnery Publishing operates from leased facilities in Washington, D.C. with inventory fulfillment managed by a third party in Jackson, Tennessee. Our current lease agreements range from one to two years remaining on the lease term.
We and our subsidiaries, incident to our business activities, are parties to a number of legal proceedings, lawsuits, arbitration and other claims. Such matters are subject to many uncertainties and outcomes that are not predictable with assurance. We maintain insurance that may provide coverage for such matters. Consequently, we are unable to ascertain the ultimate aggregate amount of monetary liability or the financial impact with respect to these matters. We believe, at this time, that the final resolution of these matters, individually and in the aggregate, will not adversely affect upon our annual consolidated financial position, results of operations or cash flows.
In April 2016, pursuant to a counterclaim to a collection suit initiated by Salem, an award was issued against Salem for breach of contract and attorney fees. We filed an appeal against the award as well as a malpractice lawsuit against the lawyer that represented Salem in the collection lawsuit. A legal reserve of $0.5 million was recorded representing the total possible loss contingency without third party recoveries from our appeal, malpractice lawsuit or insurance claims. In March 2017, the case and all counterclaims were settled for a net amount of $0.3 million.
| 41 |
ITEM 4. MINE AND SAFETY DISCLOSURES.
Not Applicable.
ITEM 5. MARKET FOR REGISTRANT’S COMMON EQUITY, RELATED STOCKHOLDER MATTERS AND ISSUER PURCHASES OF EQUITY SECURITIES.
Our Class A common stock trades on the NASDAQ Global Market® (“NASDAQ-NGM”) under the symbol SALM. On February 2, 2018, we had approximately 49 stockholders of record (not including the number of persons or entities holding stock in nominee or street name through various brokerage firms) and 20,614,801 outstanding shares of Class A common stock and two stockholders of record and 5,553,696 outstanding shares of Class B common stock. The following table sets forth for the fiscal quarters indicated the range of high and low sale price information per share of the Class A common stock of the company as reported on the NASDAQ-NGM.
| 2016 | 2017 | |||||||||||||||||||||||||||||||
| 1st Qtr | 2nd Qtr | 3rd Qtr | 4th Qtr | 1st Qtr | 2nd Qtr | 3rd Qtr | 4th Qtr | |||||||||||||||||||||||||
| High (mid-day) | $ | 6.06 | $ | 8.17 | $ | 8.10 | $ | 6.64 | $ | 7.75 | $ | 8.25 | $ | 7.45 | $ | 6.75 | ||||||||||||||||
| Low (mid-day) | $ | 3.60 | $ | 5.84 | $ | 5.68 | $ | 5.00 | $ | 6.00 | $ | 6.60 | $ | 5.95 | $ | 3.90 | ||||||||||||||||
There is no established public trading market for the company’s Class B common stock.
DIVIDEND POLICY
Our dividend policy is based upon our Board of Directors’ current assessment of our business and the environment in which we operate. The actual declaration of any future equity distributions and the establishment of the per share amount, record dates, and payment dates are subject to final determination by our Board of Directors and dependent upon future earnings, cash flows, financial and legal requirements, and other factors. The reduction or elimination of equity distributions may negatively affect the market price of our common stock.
The following table shows the equity distributions that have been declared and paid to all stockholders of record of our Class A and Class B common stock during the years ended December 31, 2017 and 2016.
| Announcement Date | Record Date | Payment Date | Amount Per Share | Cash Distributed (in thousands) | ||||||||
| December 7, 2017 | December 18, 2017 | December 29, 2017 | $ | 0.0650 | $ | 1,701 | ||||||
| September 12, 2017 | September 22, 2017 | September 29, 2017 | $ | 0.0650 | $ | 1,701 | ||||||
| June 1, 2017 | June 16, 2017 | June 30, 2017 | $ | 0.0650 | $ | 1,697 | ||||||
| March 9, 2017 | March 20, 2017 | March 31, 2017 | $ | 0.0650 | $ | 1,691 | ||||||
| December 7, 2016 | December 19, 2016 | December 31, 2016 | $ | 0.0650 | $ | 1,678 | ||||||
| September 9, 2016 | September 19, 2016 | September 30, 2016 | $ | 0.0650 | $ | 1,679 | ||||||
| June 2, 2016 | June 16, 2016 | June 30, 2016 | $ | 0.0650 | $ | 1,664 | ||||||
| March 10, 2016 | March 22, 2016 | April 5, 2016 | $ | 0.0650 | $ | 1,657 | ||||||
While we intend to pay regular quarterly distributions, the actual declaration of such future distributions and the establishment of the per share amount, record dates, and payment dates are subject to final determination by our Board of Directors and dependent upon future earnings, cash flows, financial and legal requirements, and other factors. Any future distributions are likely to be comparable to prior declarations unless there are changes in expected future earnings, cash flows, financial and legal requirements.
Based on the number of shares of Class A and Class B common stock currently outstanding we expect to pay total annual equity distributions of approximately $6.8 million in 2018.
Our sole source of cash available for making any future equity distributions is our operating cash flow subject to our Term Loan B and Revolver, which contain covenants that restrict the payment of dividends and equity distributions unless certain specified conditions are satisfied.
STOCK PRICE PERFORMANCE GRAPH
The graph below compares the cumulative total stockholder return of the our Class A common stock with the cumulative total return of the NASDAQ – Composite (^IXIC)NMS equity index and the Bloomberg Broadcast and Cable Radio Index for a five year period commencing December 31, 2012 and ending December 31, 2017. Our Class B common stock is not publicly traded and is not registered under the Exchange Act. The graph assumes that the value of an investment in our Class A common stock and each index was $100 on December 31, 2012 and that any dividends were reinvested. Stockholder returns over the indicated period are not indicative of future stockholder returns.
| 42 |
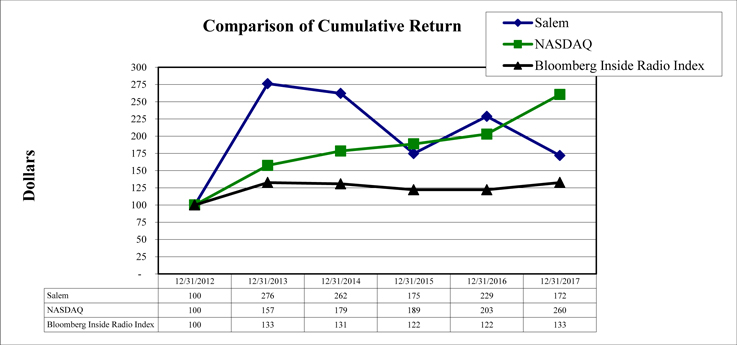
The stock price performance graph above shall not be deemed incorporated by reference into any filing under the Securities Act or the Exchange Act, except to the extent that the company specifically incorporates this information by reference, and shall not otherwise be deemed filed under such Acts.
UNREGISTERED SALES OF EQUITY SECURITIES AND USE OF PROCEEDS
None.
ITEM 6. SELECTED FINANCIAL DATA.
The selected financial data below as of and for the years ended December 31, 2017 and December 31, 2016, is derived from our audited Consolidated Financial Statements included in Item 8 of this annual report on Form 10-K. The selected financial data as of and for the years ended December 31, 2015, December 31, 2014 and December 31, 2013 is derived from our audited financial statements not included herein. The selected financial data should be read in conjunction with, and is qualified by reference to, our Consolidated Financial Statements, related notes, other financial information included (incorporated by reference) herein, and the “Management’s Discussion and Analysis of Financial Condition and Results of Operations,” including the disclosure concerning the reconciliation for historical Non-GAAP financial measures presented in “Management’s Discussion and Analysis of Financial Condition and Results of Operations–Non-GAAP Financial Measures” included in Item 7 of this annual report on Form 10-K.
| 43 |
Note that our financial results are not comparable from year to year due to acquisitions and dispositions of radio stations, digital media operations, publishing entities, asset impairments and other non-recurring significant events.
| Year Ended December 31, | ||||||||||||||||||||
| 2013 | 2014 | 2015 | 2016 | 2017 | ||||||||||||||||
| (Dollars in thousands, except share and per share data) | ||||||||||||||||||||
| Statement of Operations Data: | ||||||||||||||||||||
| Net broadcast revenue | $ | 189,892 | $ | 194,094 | $ | 197,184 | $ | 202,016 | $ | 196,197 | ||||||||||
| Net digital media revenue | 33,808 | 45,691 | 44,761 | 46,777 | 43,096 | |||||||||||||||
| Net publishing revenue | 13,234 | 26,751 | 23,842 | 25,528 | 24,443 | |||||||||||||||
| Total net revenue | 236,934 | 266,536 | 265,787 | 274,321 | 263,736 | |||||||||||||||
| Operating expenses: | ||||||||||||||||||||
| Broadcast operating expenses | 130,713 | 139,206 | 140,819 | 146,283 | 145,494 | |||||||||||||||
| Digital media operating expenses | 24,885 | 35,590 | 35,380 | 36,290 | 33,675 | |||||||||||||||
| Publishing operating expenses | 14,280 | 26,143 | 24,774 | 26,209 | 24,475 | |||||||||||||||
| Unallocated corporate expenses | 16,081 | 17,092 | 15,146 | 14,994 | 16,255 | |||||||||||||||
| Depreciation and amortization | 15,262 | 18,825 | 17,741 | 17,276 | 16,962 | |||||||||||||||
| Change in the estimated fair value of contingent earn-out consideration | — | 734 | (1,715 | ) | (689 | ) | (23 | ) | ||||||||||||
| Impairment of long-lived assets | — | — | — | 700 | — | |||||||||||||||
| Impairment of indefinite-lived long-term assets other than goodwill | 1,006 | 34 | — | 7,041 | 19 | |||||||||||||||
| Impairment of goodwill | 438 | 45 | 439 | 32 | — | |||||||||||||||
| Impairment of amortizable intangible assets | — | — | — | 8 | — | |||||||||||||||
| (Gain) loss on the sale or disposal of assets | (264 | ) | 251 | 181 | (1,901 | ) | 3,905 | |||||||||||||
| Total operating expenses | 202,401 | 237,920 | 232,765 | 246,243 | 240,762 | |||||||||||||||
| Operating income from continuing operations | 34,533 | 28,616 | 33,022 | 28,078 | 22,974 | |||||||||||||||
| Other income (expense): | ||||||||||||||||||||
| Interest income | 68 | 45 | 8 | 6 | 4 | |||||||||||||||
| Interest expense, net of capitalized interest | (16,892 | ) | (15,993 | ) | (15,429 | ) | (14,938 | ) | (16,706 | ) | ||||||||||
| Change in fair value of interest rate swaps | 3,177 | (2,702 | ) | (1,273 | ) | 285 | 357 | |||||||||||||
| Gain on bargain purchase | — | — | 1,357 | 95 | — | |||||||||||||||
| Loss on early retirement of long-term debt | (27,795 | ) | (391 | ) | (41 | ) | (87 | ) | (2,775 | ) | ||||||||||
| Net miscellaneous income and expenses | 18 | 665 | 201 | 6 | (80 | ) | ||||||||||||||
| Total other expense, net | (41,424 | ) | (18,376 | ) | (15,177 | ) | (14,633 | ) | (19,200 | ) | ||||||||||
| Income from continuing operations before income taxes | (6,891 | ) | 10,240 | 17,845 | 13,445 | 3,774 | ||||||||||||||
| Provision for (benefit from) income taxes | (4,192 | ) | 4,765 | 6,695 | 4,572 | (20,870 | ) | |||||||||||||
| Income (loss) from continuing operations | (2,699 | ) | 5,475 | 11,150 | 8,873 | 24,644 | ||||||||||||||
| Loss from discontinued operations, net of tax | (37 | ) | — | — | — | — | ||||||||||||||
| Net income (loss) | $ | (2,736 | ) | $ | 5,475 | $ | 11,150 | $ | 8,873 | $ | 24,644 | |||||||||
| Basic earnings (loss) per share data: | ||||||||||||||||||||
| Earnings (loss) per share Class A and Class B common stock from continuing operations | $ | (0.11 | ) | $ | 0.21 | $ | 0.43 | $ | 0.34 | $ | 0.94 | |||||||||
| Loss per share from discontinued operations | — | — | — | — | — | |||||||||||||||
| Net earnings (loss) per share Class A and Class B common stock | $ | (0.11 | ) | $ | 0.21 | $ | 0.43 | $ | 0.34 | $ | 0.94 | |||||||||
| Diluted earnings (loss) per share data: | ||||||||||||||||||||
| Earnings (loss) per share Class A and Class B common stock from continuing operations | $ | (0.11 | ) | $ | 0.21 | $ | 0.43 | $ | 0.34 | $ | 0.94 | |||||||||
| Loss per share from discontinued operations | — | — | — | — | — | |||||||||||||||
| Net earnings (loss) per share Class A and Class B common stock | $ | (0.11 | ) | $ | 0.21 | $ | 0.43 | $ | 0.34 | $ | 0.94 | |||||||||
| Distributions per share | $ | 0.21 | $ | 0.24 | $ | 0.26 | $ | 0.26 | $ | 0.26 | ||||||||||
| Basic weighted average Class A and Class B common shares outstanding | 24,938,075 | 25,336,809 | 25,426,732 | 25,669,538 | 26,068,942 | |||||||||||||||
| Diluted weighted average Class A and Class B common shares outstanding | 24,938,075 | 26,081,175 | 25,887,819 | 26,034,990 | 26,435,757 | |||||||||||||||
| Year Ended December 31, | ||||||||||||||||||||
| 2013 | 2014 | 2015 | 2016 | 2017 | ||||||||||||||||
| (Dollars in thousands) | ||||||||||||||||||||
| Balance Sheet Data: | ||||||||||||||||||||
| Cash and cash equivalents | $ | 65 | $ | 33 | $ | 98 | $ | 130 | $ | 3 | ||||||||||
| Broadcast licenses | 381,836 | 385,726 | 393,031 | 388,517 | 380,914 | |||||||||||||||
| Other intangible assets, net including goodwill | 32,035 | 37,912 | 36,877 | 40,353 | 39,841 | |||||||||||||||
| Total assets | 575,113 | 583,159 | 596,166 | 590,268 | 578,073 | |||||||||||||||
| Long-term debt (including current portion) | 290,793 | 277,505 | 274,755 | 261,674 | 258,688 | |||||||||||||||
| Stockholders’ equity | 199,347 | 201,468 | 207,221 | 211,192 | 231,281 | |||||||||||||||
| Cash flows related to: | ||||||||||||||||||||
| Operating activities | $ | 28,735 | $ | 41,925 | $ | 36,130 | $ | 38,866 | $ | 27,330 | ||||||||||
| Investing activities | (17,737 | ) | (21,734 | ) | (29,183 | ) | (15,493 | ) | (10,342 | ) | ||||||||||
| Financing activities | (11,276 | ) | (20,223 | ) | (6,882 | ) | (23,341 | ) | (17,115 | ) | ||||||||||
| Non-GAAP Financial Measures: | ||||||||||||||||||||
| Station Operating Income (1) | $ | 59,179 | $ | 54,888 | $ | 56,365 | $ | 55,733 | $ | 50,703 | ||||||||||
| Station Operating Income margin (2) | 31.2 | % | 28.3 | % | 28.6 | % | 27.6 | % | 25.8 | % | ||||||||||
| Digital Media Operating Income (3) | $ | 8,923 | $ | 10,101 | $ | 9,381 | $ | 10,487 | $ | 9,421 | ||||||||||
| Publishing Operating Income (Loss) (4) | $ | (1,046 | ) | $ | 608 | $ | (932 | ) | $ | (681 | ) | $ | (32 | ) | ||||||
| Adjusted EBITDA (5) | $ | 52,824 | $ | 50,081 | $ | 50,439 | $ | 51,127 | $ | 45,558 | ||||||||||
| (1) | We define non-GAAP Station Operating Income as net broadcast revenue less broadcast operating expenses. |
| (2) | We define non-GAAP Station Operating Income margin as Station Operating Income as a percentage of net broadcast revenue. |
| (3) | We define non-GAAP digital media operating income as net digital media revenue less digital media operating expenses |
| (4) | We define non-GAAP publishing operating income as net publishing revenue less publishing operating expenses. |
| (5) | We define Non-GAAP Adjusted EBITDA as net income before interest, taxes, depreciation, and amortization (EBITDA) before gains or losses on the sale or disposal of assets, before changes in the estimated fair value of contingent earn-out consideration, before the change in fair value of interest rate swaps, before the impairment of long-lived assets, before net miscellaneous income and expenses, before loss on early retirement of debt and before non-cash compensation expense. |
| 44 |
NON-GAAP FINANCIAL MEASURES
Management uses certain non-GAAP financial measures defined below in communications with investors, analysts, rating agencies, banks and others to assist such parties in understanding the impact of various items on our financial statements. We use these non-GAAP financial measures to evaluate financial results, develop budgets, manage expenditures and as a measure of performance under compensation programs.
Our presentation of these non-GAAP financial measures should not be considered as a substitute for or superior to the most directly comparable financial measures as reported in accordance with GAAP.
Item 10I of Regulation S-K defines and prescribes the conditions under which certain non-GAAP financial information may be presented in this report. We closely monitor EBITDA, Adjusted EBITDA, Station Operating Income (“SOI”), Same Station net broadcast revenue, Same Station broadcast operating expenses, Same Station Operating Income, Digital Media Operating Income, and Publishing Operating Income, all of which are non-GAAP financial measures. We believe that these non-GAAP financial measures provide useful information about our core operating results, and thus, are appropriate to enhance the overall understanding of our financial performance. These non-GAAP financial measures are intended to provide management and investors a more complete understanding of our underlying operational results, trends and performance.
The performance of a radio broadcasting company is customarily measured by the ability of its stations to generate SOI. We define SOI as net broadcast revenue less broadcast operating expenses. Accordingly, changes in net broadcast revenue and broadcast operating expenses, as explained above, have a direct impact on changes in SOI. SOI is not a measure of performance calculated in accordance with GAAP. SOI should be viewed as a supplement to and not a substitute for our results of operations presented on the basis of GAAP. We believe that SOI is a useful non-GAAP financial measure to investors when considered in conjunction with operating income (the most directly comparable GAAP financial measures to SOI), because it is generally recognized by the radio broadcasting industry as a tool in measuring performance and in applying valuation methodologies for companies in the media, entertainment and communications industries. SOI is commonly used by investors and analysts who report on the industry to provide comparisons between broadcasting groups. We use SOI as one of the key measures of operating efficiency and profitability, including our internal reviews associated with impairment analysis of our indefinite-lived intangible assets. SOI does not purport to represent cash provided by operating activities. Our statement of cash flows presents our cash activity in accordance with GAAP and our income statement presents our financial performance prepared in accordance with GAAP. Our definition of SOI is not necessarily comparable to similarly titled measures reported by other companies.
We define Same Station net broadcast revenue as net broadcast revenue from our radio stations and networks that we own or operate in the same format on the first and last day of each quarter, as well as the corresponding quarter of the prior year. We define Same Station broadcast operating expenses as broadcast operating expenses from our radio stations and networks that we own or operate in the same format on the first and last day of each quarter, as well as the corresponding quarter of the prior year. Same Station Operating Income includes those stations we own or operate in the same format on the first and last day of each quarter, as well as the corresponding quarter of the prior year. Same Station Operating Income for a full calendar year is calculated as the sum of the Same Station-results for each of the four quarters of that year. We use Same Station Operating Income, a non-GAAP financial measure, both in presenting our results to stockholders and the investment community, and in our internal evaluations and management of the business. We believe that Same Station Operating Income provides a meaningful comparison of period over period performance of our core broadcast operations as this measure excludes the impact of new stations, the impact of stations we no longer own or operate, and the impact of stations operating under a new programming format. Our presentation of Same Station Operating Income is not intended to be considered in isolation or as a substitute for the most directly comparable financial measures reported in accordance with GAAP. Our definition of Same Station net broadcast revenue, Same Station broadcast operating expenses and Same Station Operating Income is not necessarily comparable to similarly titled measures reported by other companies.
We apply a similar methodology to our digital media and publishing group. Digital Media Operating Income is defined as net digital media revenue less digital media operating expenses. Publishing Operating Income is defined as net publishing revenue less publishing operating expenses. Digital Media Operating Income and Publishing Operating Income are not measures of performance in accordance with GAAP. Our presentations of these non-GAAP financial performance measures are not to be considered a substitute for or superior to our operating results reported in accordance with GAAP. We believe that Digital Media Operating Income and Publishing Operating Income are useful non-GAAP financial measures to investors, when considered in conjunction with operating income (the most directly comparable GAAP financial measure), because they are comparable to those used to measure performance of our broadcasting entities. We use this analysis as one of the key measures of operating efficiency, profitability and in our internal review. This measurement does not purport to represent cash provided by operating activities. Our statement of cash flows presents our cash activity in accordance with GAAP and our income statement presents our financial performance in accordance with GAAP. Our definitions of Digital Media Operating Income and Publishing Operating Income are not necessarily comparable to similarly titled measures reported by other companies.
| 45 |
We define EBITDA as net income before interest, taxes, depreciation, and amortization. We define Adjusted EBITDA as EBITDA before gains or losses on the sale or disposal of assets, before changes in the estimated fair value of contingent earn-out consideration, before gains on bargain purchases, before the change in fair value of interest rate swaps, before impairments, before net miscellaneous income and expenses, before loss on early retirement of debt, before (gain) loss from discontinued operations and before non-cash compensation expense. EBITDA and Adjusted EBITDA are commonly used by the broadcast and media industry as important measures of performance and are used by investors and analysts who report on the industry to provide meaningful comparisons between broadcasters. EBITDA and Adjusted EBITDA are not measures of liquidity or of performance in accordance with GAAP and should be viewed as a supplement to and not a substitute for or superior to our results of operations and financial condition presented in accordance with GAAP. Our definitions of EBITDA and Adjusted EBITDA are not necessarily comparable to similarly titled measures reported by other companies.
For all non-GAAP financial measures, investors should consider the limitations associated with these metrics, including the potential lack of comparability of these measures from one company to another.
We use non-GAAP financial measures to evaluate financial performance, develop budgets, manage expenditures, and determine employee compensation. Our presentation of this additional information is not to be considered as a substitute for or superior to the most directly comparable measures reported in accordance with GAAP.
RECONCILIATION OF NON-GAAP FINANCIAL MEASURES:
In the tables below, we present a reconciliation of net broadcast revenue, the most comparable GAAP measure, to Same Station net broadcast revenue, and broadcast operating expenses, the most comparable GAAP measure to Same Station broadcast operating expense. We show our calculation of Station Operating Income and Same Station Operating Income, which is reconciled from net income, the most comparable GAAP measure in the table following our calculation of Digital Media Operating Income and Publishing Operating Income (Loss). Our presentation of these non-GAAP measures are not to be considered a substitute for or superior to the most directly comparable measures reported in accordance with GAAP.
| Year Ended December 31, | ||||||||||||||||||||
| 2013 | 2014 | 2015 | 2016 | 2017 | ||||||||||||||||
| (Dollars in thousands) | ||||||||||||||||||||
| Reconciliation of Net Broadcast Revenue to Same Station Net Broadcast Revenue | ||||||||||||||||||||
| Net broadcast revenue | $ | 189,892 | $ | 194,094 | $ | 197,184 | $ | 202,016 | $ | 196,197 | ||||||||||
| Net broadcast revenue – acquisitions | (65 | ) | (1,551 | ) | (105 | ) | (11 | ) | (428 | ) | ||||||||||
| Net broadcast revenue – format change | — | — | (107 | ) | (58 | ) | (110 | ) | ||||||||||||
| Net broadcast revenue – dispositions | — | — | — | (1,532 | ) | (174 | ) | |||||||||||||
| Same Station net broadcast revenue | $ | 189,827 | $ | 192,543 | $ | 196,972 | $ | 200,415 | $ | 195,485 | ||||||||||
| Reconciliation of Broadcast Operating Expenses to Same Station Broadcast Operating Expenses | ||||||||||||||||||||
| Broadcast operating expenses | $ | 130,713 | $ | 139,206 | $ | 140,819 | $ | 146,283 | $ | 145,494 | ||||||||||
| Broadcast operating expenses – acquisitions | (136 | ) | (1,848 | ) | (140 | ) | (23 | ) | (673 | ) | ||||||||||
| Broadcast operating expenses – format change | — | — | (192 | ) | (118 | ) | (180 | ) | ||||||||||||
| Broadcast operating expenses – dispositions | — | — | — | (1,564 | ) | (105 | ) | |||||||||||||
| Same Station broadcast operating expenses | $ | 130,577 | $ | 137,358 | $ | 140,487 | $ | 144,578 | $ | 144,536 | ||||||||||
| Reconciliation of Station Operating Income to Same Station Operating Income | ||||||||||||||||||||
| Station Operating Income | $ | 59,179 | $ | 54,888 | $ | 56,365 | $ | 55,733 | $ | 50,703 | ||||||||||
| Station operating loss – acquisitions | 71 | 297 | 35 | 12 | 245 | |||||||||||||||
| Station operating income – format change | — | — | 85 | 60 | 70 | |||||||||||||||
| Station operating income – dispositions | — | — | — | 32 | (69 | ) | ||||||||||||||
| Same Station – Station Operating Income | $ | 59,250 | $ | 55,185 | $ | 56,485 | $ | 55,837 | $ | 50,949 | ||||||||||
In the table below, we present our calculations of Station Operating Income, Digital Media Operating Income and Publishing Operating Income. Our presentation of these non-GAAP performance indicators are not to be considered a substitute for or superior to the directly comparable measures reported in accordance with GAAP.
| Year Ended December 31, | ||||||||||||||||||||
| 2013 | 2014 | 2015 | 2016 | 2017 | ||||||||||||||||
| (Dollars in thousands) | ||||||||||||||||||||
| Calculation of Station Operating Income, Digital Media Operating Income and Publishing Operating Income (Loss) | ||||||||||||||||||||
| Net broadcast revenue | $ | 189,892 | $ | 194,094 | $ | 197,184 | $ | 202,016 | $ | 196,197 | ||||||||||
| Less broadcast operating expenses | (130,713 | ) | (139,206 | ) | (140,819 | ) | (146,283 | ) | (145,494 | ) | ||||||||||
| Station Operating Income | $ | 59,179 | $ | 54,888 | $ | 56,365 | $ | 55,733 | $ | 50,703 | ||||||||||
| Net digital media revenue | $ | 33,808 | $ | 45,691 | $ | 44,761 | $ | 46,777 | $ | 43,096 | ||||||||||
| Less digital media operating expenses | (24,885 | ) | (35,590 | ) | (35,380 | ) | (36,290 | ) | (33,675 | ) | ||||||||||
| Digital Media Operating Income | $ | 8,923 | $ | 10,101 | $ | 9,381 | $ | 10,487 | $ | 9,421 | ||||||||||
| Net publishing revenue | $ | 13,234 | $ | 26,751 | $ | 23,842 | $ | 25,528 | $ | 24,443 | ||||||||||
| Less publishing operating expenses | (14,280 | ) | (26,143 | ) | (24,774 | ) | (26,209 | ) | (24,475 | ) | ||||||||||
| Publishing Operating Income (Loss) | $ | (1,046 | ) | $ | 608 | $ | (932 | ) | $ | (681 | ) | $ | (32 | ) | ||||||
| 46 |
In the table below, we present a reconciliation of net income, the most directly comparable GAAP measure to Station Operating Income, Digital Media Operating Income and Publishing Operating Income (Loss). Our presentation of these non-GAAP performance indicators are not to be considered a substitute for or superior to the most directly comparable measures reported in accordance with GAAP.
| Year Ended December 31, | ||||||||||||||||||||
| 2013 | 2014 | 2015 | 2016 | 2017 | ||||||||||||||||
| (Dollars in thousands) | ||||||||||||||||||||
| Reconciliation of Net Income (Loss) to Operating Income and Station Operating Income, Digital Media Operating Income and Publishing Operating Income (Loss) | ||||||||||||||||||||
| Net income (loss) | $ | (2,736 | ) | $ | 5,475 | $ | 11,150 | $ | 8,873 | $ | 24,644 | |||||||||
| Plus loss from discontinued operations | 37 | — | — | — | — | |||||||||||||||
| Plus provision for (benefit from) income taxes | (4,192 | ) | 4,765 | 6,695 | 4,572 | (20,870 | ) | |||||||||||||
| Plus net miscellaneous income and (expenses) | (18 | ) | (665 | ) | (201 | ) | (6 | ) | 80 | |||||||||||
| Plus gain on bargain purchase | ― | ― | (1,357 | ) | (95 | ) | ― | |||||||||||||
| Plus loss on early retirement of long-term debt | 27,795 | 391 | 41 | 87 | 2,775 | |||||||||||||||
| Plus change in fair value of interest rate swaps | (3,177 | ) | 2,702 | 1,273 | (285 | ) | (357 | ) | ||||||||||||
| Plus interest expense, net of capitalized interest | 16,892 | 15,993 | 15,429 | 14,938 | 16,706 | |||||||||||||||
| Less interest income | (68 | ) | (45 | ) | (8 | ) | (6 | ) | (4 | ) | ||||||||||
| Net operating income from continuing operations | $ | 34,533 | $ | 28,616 | $ | 33,022 | $ | 28,078 | $ | 22,974 | ||||||||||
| Less (gain) loss on the sale or disposal of assets | (264 | ) | 251 | 181 | (1,901 | ) | 3,905 | |||||||||||||
| Plus impairment of amortizable intangible assets | — | — | — | 8 | ― | |||||||||||||||
| Plus impairment of goodwill | 438 | 45 | 439 | 32 | ― | |||||||||||||||
| Plus impairment of indefinite-lived long-term assets other than goodwill | 1,006 | 34 | — | 7,041 | 19 | |||||||||||||||
| Plus impairment of long-lived assets | — | — | — | 700 | ― | |||||||||||||||
| Less change in the estimated fair value of contingent earn-out consideration | — | 734 | (1,715 | ) | (689 | ) | (23 | ) | ||||||||||||
| Plus depreciation and amortization | 15,262 | 18,825 | 17,741 | 17,276 | 16,962 | |||||||||||||||
| Plus unallocated corporate expenses | 16,081 | 17,092 | 15,146 | 14,994 | 16,255 | |||||||||||||||
| Combined Station Operating Income, Digital Media Operating Income and Publishing Operating Income (Loss) | $ | 67,056 | $ | 65,597 | $ | 64,814 | $ | 65,539 | $ | 60,092 | ||||||||||
| Station Operating Income | $ | 59,179 | $ | 54,888 | $ | 56,365 | $ | 55,733 | $ | 50,703 | ||||||||||
| Digital Media Operating Income | 8,923 | 10,101 | 9,381 | 10,487 | 9,421 | |||||||||||||||
| Publishing Operating Income (Loss) | (1,046 | ) | 608 | (932 | ) | (681 | ) | (32 | ) | |||||||||||
| $ | 67,056 | $ | 65,597 | $ | 64,814 | $ | 65,539 | $ | 60,092 | |||||||||||
In the table below, we present a reconciliation of Adjusted EBITDA to EBITDA to Net Income (Loss), the most directly comparable GAAP measure. EBITDA and Adjusted EBITDA are non-GAAP financial performance measures that are not to be considered a substitute for or superior to the most directly comparable measures reported in accordance with GAAP.
| Year Ended December 31, | ||||||||||||||||||||
| 2013 | 2014 | 2015 | 2016 | 2017 | ||||||||||||||||
| (Dollars in thousands) | ||||||||||||||||||||
| Reconciliation of Adjusted EBITDA to EBITDA to Net Income | ||||||||||||||||||||
| Net income (loss) | $ | (2,736 | ) | $ | 5,475 | $ | 11,150 | $ | 8,873 | $ | 24,644 | |||||||||
| Plus interest expense, net of capitalized interest | 16,892 | 15,993 | 15,429 | 14,938 | 16,706 | |||||||||||||||
| Plus provision for (benefit from) income taxes | (4,192 | ) | 4,765 | 6,695 | 4,572 | (20,870 | ) | |||||||||||||
| Plus depreciation and amortization | 15,262 | 18,825 | 17,741 | 17,276 | 16,962 | |||||||||||||||
| Less interest income | (68 | ) | (45 | ) | (8 | ) | (6 | ) | (4 | ) | ||||||||||
| EBITDA | $ | 25,158 | $ | 45,013 | $ | 51,007 | $ | 45,653 | $ | 37,438 | ||||||||||
| Less (gain) loss on the sale or disposal of assets | (264 | ) | 251 | 181 | (1,901 | ) | 3,905 | |||||||||||||
| Less change in the estimated fair value of contingent earn-out consideration | ― | 734 | (1,715 | ) | (689 | ) | (23 | ) | ||||||||||||
| Plus gain on bargain purchase | ― | ― | (1,357 | ) | (95 | ) | ― | |||||||||||||
| Plus changes the fair value of interest rate swaps | (3,177 | ) | 2,702 | 1,273 | (285 | ) | (357 | ) | ||||||||||||
| Plus impairment of long-lived assets | ― | ― | ― | 700 | ― | |||||||||||||||
| Plus impairment of indefinite-lived long-term assets other than goodwill | 1,006 | 34 | ― | 7,041 | ― | |||||||||||||||
| Plus impairment of goodwill | 438 | 45 | 439 | 32 | 19 | |||||||||||||||
| Plus impairment of amortizable intangible assets | ― | ― | ― | 8 | ― | |||||||||||||||
| Plus net miscellaneous income and expenses | (18 | ) | (665 | ) | (201 | ) | (6 | ) | 80 | |||||||||||
| Plus loss on early retirement of long-term debt | 27,795 | 391 | 41 | 87 | 2,775 | |||||||||||||||
| Plus loss from discontinued operations | 37 | ― | ― | ― | ― | |||||||||||||||
| Plus non-cash stock-based compensation | 1,849 | 1,576 | 771 | 582 | 1,721 | |||||||||||||||
| Adjusted EBITDA | $ | 52,824 | $ | 50,081 | $ | 50,439 | $ | 51,127 | $ | 45,558 | ||||||||||
| 47 |
ITEM 7. MANAGEMENT’S DISCUSSION AND ANALYSIS OF FINANCIAL CONDITION AND RESULTS OF OPERATIONS.
GENERAL
The following discussion and analysis of our financial condition and results of operations should be read in conjunction with the Consolidated Financial Statements and related notes included elsewhere in this annual report on Form 10-K. Our Consolidated Financial Statements are not directly comparable from period to period due to acquisitions and dispositions of selected radio station assets, digital and publishing businesses. Refer to Note 4 of our Consolidated Financial Statements under Item 8 of this annual report on Form 10-K for details of each of these transactions.
Historical operating results are not necessarily indicative of future operating results. Actual future results may differ from those contained in or implied by the forward-looking statements as a result of various factors. These factors include, but are not limited to, risks and uncertainties relating to the need for additional funds to service our debt and to execute our business strategy, our ability to access borrowings under our ABL, reductions in revenue forecasts, our ability to renew our broadcast licenses, changes in interest rates, the timing of, our ability to complete any acquisitions or dispositions, costs and synergies resulting from the integration of any completed acquisitions, our ability to effectively manage costs, our ability to drive and manage growth, the popularity of radio as a broadcasting and advertising medium, changes in consumer tastes, the impact of general economic conditions in the United States or in specific markets in which we do business, industry conditions, including existing competition and future competitive technologies and cancellation, disruptions or postponements of advertising schedules in response to national or world events, our ability to generate revenues from new sources, including local commerce and technology-based initiatives, the impact of regulatory rules or proceedings that may affect our business from time to time, the future write off of any material portion of the fair value of our FCC broadcast licenses and goodwill, and other risk factors described in Item 1A of this Annual Report on Form 10-K for the year ended December 31, 2017.
Our Consolidated Financial Statements are not directly comparable from period to period due to acquisitions and dispositions of selected assets of radio stations and acquisitions of various Internet and publishing businesses. Refer to Note 4 of our Consolidated Financial Statements for details of each of these transactions. Certain reclassifications have been made to the prior year financial statements to conform to the current year presentation.
Salem Media Group, Inc. (“Salem”) is a domestic multimedia company specializing in Christian and conservative content, with media properties comprising radio broadcasting, digital media, and publishing. Effective February 19, 2015, we changed our name from Salem Communications Corporation to Salem Media Group, Inc. Salem was formed in 1986 as a California corporation and was reincorporated in Delaware in 1999. Our content is intended for audiences interested in Christian and family-themed programming and conservative news talk. We maintain a website at www.salemmedia.com. Our annual reports on Form 10-K, quarterly reports on Form 10-Q, current reports on Form 8-K, and any amendments to these reports are available free of charge through our website as soon as reasonably practicable after those reports are electronically filed with or furnished to the SEC. The information on our website is not a part of or incorporated by reference into this or any other report of the company filed with, or furnished to, the SEC.
OVERVIEW
We have three operating segments: (1) Broadcast, (2) Digital Media, and (3) Publishing, which also qualify as reportable segments. Our operating segments reflect how our chief operating decision makers, which we define as a collective group of senior executives, assess the performance of each operating segment and determine the appropriate allocations of resources to each segment. We continually review our operating segment classifications to align with operational changes in our business and may make changes as necessary.
We measure and evaluate our operating segments based on operating income and operating expenses that exclude costs related to corporate functions, such as accounting and finance, human resources, legal, tax and treasury. We also exclude costs such as amortization, depreciation, taxes and interest expense when evaluating the performance of our operating segments.
Our principal sources of broadcast revenue include:
| · | the sale of block program time to national and local program producers; |
| · | the sale of advertising time on our radio stations to national and local advertisers; |
| · | the sale of advertising time on our national network; |
| · | the syndication of programming on our national network; |
| · | the sale of banner advertisements on our station websites or on our mobile applications; |
| · | the sale of digital streaming advertisements on our station websites or on our mobile applications; |
| · | the sale of advertisements included in digital newsletters; |
| · | fees earned for creating custom web pages or social media promotions on behalf of our advertisers; |
| · | revenue from station events, including ticket sales and sponsorships; |
| 48 |
| · | listener purchase programs, often called non-traditional revenue, where revenue is generated by promoting discounted goods and services to our listeners from special discounts and incentives offered to our listeners; and |
| · | product sales and royalties for on-air host materials, including podcasts and programs; |
The rates we are able to charge for broadcast airtime and other advertisements are dependent upon several factors, including:
| · | audience share; |
| · | how well our stations and digital platform perform for our clients; |
| · | the size of the market and audience reached; |
| · | the number of impressions delivered; |
| · | the number of page views achieved; |
| · | the number of events held, the number of event sponsorships sold and the attendance at each event; |
| · | the general economic conditions in each market; and |
| · | supply and demand on both a local and national level. |
Our principal sources of digital media revenue include:
| · | the sale of digital banner advertisements on our websites and mobile applications; |
| · | the sale of digital streaming advertisements on websites and mobile applications; |
| · | the support and promotion to stream third-party content on our websites; |
| · | the sale of advertisements included in digital newsletters; |
| · | the digital delivery of newsletters to subscribers; |
| · | the number of video and graphic downloads; and |
| · | the sale and delivery of wellness products. |
Our principal sources of publishing revenue include:
| · | the sale of books and e-books; |
| · | publishing fees from authors; |
| · | the sale of digital advertising on our magazine websites and digital newsletters; |
| · | subscription fees for our print magazine; and |
| · | the sale of print magazine advertising.. |
Broadcasting
Our foundational business is radio broadcasting, which includes the ownership and operation of radio stations in large metropolitan markets. We also own and operate Salem Radio Network® (“SRN”), SRN News Network (“SNN”), Today’s Christian Music (“TCM”), Singing News Network, and Salem Media RepresentativesTM (“SMR”). SRN, SNN, TCM and Singing News Network are networks that develop, produce and syndicate a broad range of programming specifically targeted to Christian and family-themed talk stations, music stations and News Talk stations throughout the United States, including Salem-owned and operated stations. SMR, a national advertising sales firm with offices in ten U.S. cities, specializes in placing national advertising on religious and other format commercial radio stations.
Our five main formats are (1) Christian Teaching and Talk, (2) News Talk, (3) Contemporary Christian Music, (4) Spanish Language Christian Teaching and Talk and (5) Business.
Christian Teaching and Talk. We currently program 40 of our radio stations in our foundational format, Christian Teaching and Talk, which is talk programming emphasizing Christian and family themes. Through this format, a listener can hear Bible teachings and sermons, as well as gain insight to questions related to daily life, such as raising children or religious legal rights in education and in the workplace. This format uses block programming time to offer a learning resource and a source of personal support for listeners. Listeners often contact our programmers to ask questions, obtain materials on a subject matter or receive study guides based on what they have learned on the radio.
Block Programming. We sell blocks of airtime on our Christian Teaching and Talk format stations to a variety of national and local religious and charitable organizations that we believe create compelling radio programs. Historically, more than 95% of these religious and charitable organizations renew their annual programming relationships with us. Based on our historical renewal rates, we believe that block programming provides a steady and consistent source of revenue and cash flows. Our top ten programmers have remained relatively constant and average more than 30 years on-air. Over the last five years, block-programming revenue has generated 41% to 43% of our total net broadcast revenue.
Satellite Radio. We program SiriusXM Channel 131, the exclusive Christian Teaching and Talk channel on SiriusXM, reaching the entire nation 24 hours a day, seven days a week.
| 49 |
News Talk. We currently program 34 of our radio stations in a News Talk format. Our research shows that our News Talk format is highly complementary to our core Christian Teaching and Talk format. As programmed by Salem, both of these formats express conservative views and family values. Our News Talk format also provides for the opportunity to leverage syndicated talk programming produced by SRN to radio stations throughout the United States. Syndication of our programs allows Salem to reach audiences in markets in which we do not own or operate radio stations.
Contemporary Christian Music. We currently program 13 radio stations in a Contemporary Christian Music (“CCM”) format, branded The FISH® in most markets. Through the CCM format, we are able to bring listeners the words of inspirational recording artists, set to upbeat contemporary music. Our music format, branded “Safe for the Whole Family®”, features sounds that listeners of all ages can enjoy and lyrics that can be appreciated. The CCM genre continues to be popular. We believe that the listener base for CCM is underserved in terms of radio coverage, particularly in larger markets, and that our stations fill an otherwise void area in listener choices.
Spanish Language Christian Teaching and Talk. We currently program seven of our radio stations in a Spanish Language Christian Teaching and Talk format. This format is similar to our core Christian Teaching and Talk format in that it broadcasts biblical and family-themed programming, but the programming is specifically tailored for Spanish-speaking audiences. Additionally, block programming on our Spanish Language Christian Teaching and Talk stations is primarily local while Christian Teaching and Talk stations are primarily national.
Business. We currently program 12 of our radio stations in a business format. Our business format features financial commentators, business talk, and nationally recognized Bloomberg programming. The business format operates similar to our Christian Teaching and Talk format in that it features long-form block programming.
Each of our radio stations has a website specifically designed for that station. The station websites have digital banner advertisements, streaming, links to purchase goods featured by on-air advertisers, and links to our other digital media sites.
Revenues generated from our radio stations are reported as broadcast revenue in our Consolidated Financial Statements included in Item 8 of this annual report on Form 10-K Broadcast revenues are impacted by the rates radio stations can charge for programming and advertising time, the level of airtime sold to programmers and advertisers, the number of impressions delivered or downloads made, and the number of events held, including the size of the event and the number of attendees. Block programming rates are based upon our stations’ ability to attract audiences that will support the program producers through contributions and purchases of their products. Advertising rates are based upon the demand for advertising time, which in turn is based on our stations and networks’ ability to produce results for their advertisers. We market ourselves to advertisers based on the responsiveness of our audiences. We do not subscribe to traditional audience measuring services for most of our radio stations. In select markets, we subscribe to Nielsen Audio, which develops quarterly reports measuring a radio station’s audience share in the demographic groups targeted by advertisers. Each of our radio stations and our networks has a pre-determined level of time available for block programming and/or advertising, which may vary at different times of the day.
Nielsen Audio uses the Portable People Meter TM (“PPM”) technology to collect data for its ratings service. PPM is a small device that is capable of automatically measuring radio, television, Internet, satellite radio and satellite television signals encoded by the broadcaster. The PPM offers a number of advantages over traditional diary ratings collection systems, including ease of use, more reliable ratings data, shorter time periods between when advertising runs and actual listening data, and little manipulation of data by users. A disadvantage of the PPM includes data fluctuations from changes to the “panel” (a group of individuals holding PPM devices). This makes all stations susceptible to some inconsistencies in ratings that may or may not accurately reflect the actual number of listeners at any given time.
As is typical in the radio broadcasting industry, our second and fourth quarter advertising revenue generally exceeds our first and third quarter advertising revenue. This seasonal fluctuation in advertising revenue corresponds with quarterly fluctuations in the retail advertising industry. Additionally, we experience increased demand for advertising during election years by way of political advertisements. Quarterly block programming revenue tends not to vary significantly because program rates are generally set annually and recognized on a per program basis.
Our cash flows from broadcasting are affected by transitional periods experienced by radio stations when, based on the nature of the radio station, our plans for the market and other circumstances, we find it beneficial to change the station format. During this transitional period, when we develop a radio station’s listener and customer base, the station may generate negative or insignificant cash flow.
Trade or barter agreements are common in the broadcast industry. Our radio stations utilize barter agreements to exchange airtime for goods or services in lieu of cash. We enter barter agreements if the goods or services to be received can be used in our business or can be sold to our audience under Listener Purchase Programs. We minimize the use of barter agreements with our general policy being not to preempt airtime paid for in cash for airtime sold under a barter agreement. In the year ended December 31, 2017, 98% of our broadcast revenue was sold for cash as compared to 97% for the years ended December 31, 2016 and 2015.
| 50 |
Broadcast operating expenses include: (i) employee salaries, commissions and related employee benefits and taxes, (ii) facility expenses such as rent and utilities, (iii) marketing and promotional expenses, (iv) production and programming expenses, and (v) music license fees. In addition to these expenses, our network incurs programming costs and lease expenses for satellite communication facilities.
Digital Media
Web-based and digital content has been a growth area for Salem and continues to be a focus of future development. Our digital media based businesses provide Christian, conservative, investing and health-themed content, e-commerce, audio and video streaming, and other resources digitally through the web. Salem Web Network™ (“SWN”) websites include Christian content websites; BibleStudyTools.com™, Crosswalk.com®, GodVine.com™, iBelieve.com, GodTube.com™, OnePlace.com™, Christianity.com™, GodUpdates.com, CrossCards.com™, ChristianHeadlines.com, LightSource.com™, AllCreated.com, ChristianRadio.com™, CCMmagazine.com™, SingingNews.com™ and SouthernGospel.com™ and our conservative opinion websites; collectively known as Townhall Media, include Townhall.com™, HotAir.com™, Twitchy.com, RedState.com, BearingArms.com, HumanEvents.com, and ConservativeRadio.com. We also publish digital newsletters through Eagle Financial Publications, which provide market analysis and non-individualized investment strategies from financial commentators on a subscription basis.
Our church e-commerce websites, including SermonSpice.com™, ChurchStaffing.com™, WorshipHouseMedia.com, SermonSearch.com, WorshipHouseKids.com, Preaching.com, ChristianJobs.com™ and Youthworker.com and offer a variety of digital resources including videos, song tracks, sermon archives and job listings to pastors and Church leaders.
E-commerce also includes wellness products through NNH, which is a seller of nutritional supplements.
The revenues generated from this segment are reported as digital media revenue in our Consolidated Statements of Operations included in this annual report on Form 10-K. Digital media revenues are impacted by the rates our sites can charge for advertising time, the level of advertisements sold, the number of impressions delivered or the number of products sold and the number of digital subscriptions sold. Like our broadcasting segment, our second and fourth quarter advertising revenue generally exceeds our first and third quarter advertising revenue. This seasonal fluctuation in advertising revenue corresponds with quarterly fluctuations in the retail advertising industry. We also experience fluctuations in quarter-over-quarter comparisons based on the date on which the Easter holiday is observed, as this holiday generates a higher volume of product downloads from our church product sites. Additionally, we experience increased demand for advertising time and placement during election years for political advertisements.
The primary operating expenses incurred by our digital media businesses include: (i) employee salaries, commissions and related employee benefits and taxes, (ii) facility expenses such as rent and utilities, (iii) marketing and promotional expenses, (iv) royalties, (v) streaming costs, and (vi) cost of goods sold associated with e-commerce sites.
Publishing
Our publishing operations include book publishing through Regnery Publishing, print magazines and our self-publishing services. Regnery Publishing has published dozens of bestselling books by leading conservative authors and personalities, including Ann Coulter, Newt Gingrich, David Limbaugh, Ed Klein, Mark Steyn and Dinesh D’Souza. Books are sold in traditional printed form and as eBooks.
Salem Author Services includes Xulon Press™, Mill City Press, and Bookprinting.com, which offer print-on-demand self-publishing services for authors. We acquired Mill City Press and Bookprinting.com, on August 1, 2016. Xulon Press™ publishes books for Christian authors while Mill City Press and Bookprinting.com publish books for all general market publications.
Singing News® magazine, previously Salem Publishing™ produces and distributes the Singing News® magazine.
The revenues generated from this segment are reported as publishing revenue in our Consolidated Statements of Operations included in this annual report on Form 10-K. Publishing revenue is impacted by the retail price of books and e-books, the number of books sold, the number and retail price of e-books sold, the number and rate of print magazine subscriptions sold, the rate and number of pages of advertisements sold in each print magazine, and the number and rate at which self-published books are published. Regnery Publishing revenue is impacted by elections as it generates higher levels of interest and demand for publications containing conservative and political based opinions.
The primary operating expenses incurred by our Publishing businesses include: (i) employee salaries, commissions and related employee benefits and taxes, (ii) facility expenses such as rent and utilities, (iii) marketing and promotional expenses; and (iv) cost of goods sold that includes printing and production costs, fulfillment costs, author royalties and inventory reserves.
| 51 |
KNOWN TRENDS AND UNCERTAINTIES
Broadcast revenue growth remains challenged, which we believe is due to several factors, including increasing competition from other forms of content distribution and time spent listening by audio streaming services, podcasts and satellite radio. This increase in competition and mix of radio listening time may lead advertisers to conclude that the effectiveness of radio has diminished. To minimize the impact of these factors, we continue to enhance our digital assets to complement our broadcast content. We also support industry initiatives to increase the number of smartphones and other wireless devices that contain an enabled FM tuner, as well as provide initiatives for wireless carriers in the United States to permit these FM tuners to receive the free over-the-air local radio stations. The increase use of voice activated platforms, or smart speakers, that provide audiences with the ability to access AM and FM radio stations show increased potential for broadcasters to reach audiences.
Our broadcast revenues are particularly dependent on our Los Angeles and Dallas markets, which generated 12.2% and 10.3%, respectively, of our total net broadcasting revenue for the year ended December 31, 2017.
Revenues from print magazines, including advertising revenue and subscription revenues, are challenged both economically and by the increasing use of other mediums that deliver comparable information. Book sales are contingent upon overall economic conditions and our ability to attract and retain authors. Because digital media has been a growth area for us, decreases in digital revenue streams could adversely affect our operating results, financial condition and results of operations. Digital revenue is impacted by the nature and delivery of page views. We have experienced a shift in the number of page views from desktop devices to mobile devices. While mobile page views have increased dramatically, they carry a lower number of advertisements per page which are generally sold at lower rates. Digital media revenue is impacted by page views and the number of advertisements per page. Declines in desktop page views impact revenue as mobile devices carry lower rates and less advertisement per page. To minimize the impact that any one of these areas could have, we continue to explore opportunities to cross-promote our brands and our content, and to strategically monitor costs.
Key Financial Performance Indicators – SAME STATION DEFINITION
In the discussion of our results of operations below, we compare our broadcast operating results between periods on an as-reported basis, which includes the operating results of all radio stations and networks owned or operated at any time during either period and on a Same Station basis. Same Station is a Non-GAAP financial measure used both in presenting our results to stockholders and the investment community as well as in our internal evaluations and management of the business. We believe that Same Station Operating Income provides a meaningful comparison of period over period performance of our core broadcast operations as this measure excludes the impact of new stations, the impact of stations we no longer own or operate, and the impact of stations operating under a new programming format. Our presentation of Same Station Operating Income is not intended to be considered in isolation or as a substitute for the most directly comparable financial measures reported in accordance with GAAP. Our definition of Same Station Operating Income is not necessarily comparable to similarly titled measures reported by other companies Refer to “NON-GAAP FINANCIAL MEASURES” presented after our results of operation for a reconciliation of these non-GAAP performance measures to the most comparable GAAP measures.
We define Same Station net broadcast revenue as net broadcast revenue from our radio stations and networks that we own or operate in the same format on the first and last day of each quarter, as well as the corresponding quarter of the prior year. We define Same Station broadcast operating expenses as broadcast operating expenses from our radio stations and networks that we own or operate in the same format on the first and last day of each quarter, as well as the corresponding quarter of the prior year. Same Station Operating Income includes those stations we own or operate in the same format on the first and last day of each quarter, as well as the corresponding quarter of the prior year. Same Station Operating Income for a full calendar year is calculated as the sum of the Same Station results for each of the four quarters of that year.
RESULTS OF OPERATIONS
Year Ended December 31, 2017 compared to the year ended December 31, 2016
The following factors affected our results of operations and our cash flows for the year ended December 31, 2017 as compared to the prior year:
Financing
| · | On May 19, 2017, we closed on a private offering of Notes and concurrently entered into the ABL Facility. The net proceeds from the offering of the Notes, together with borrowings under the ABL Facility, were used to repay outstanding borrowings, including accrued and unpaid interest, on our previously existing senior credit facilities consisting of the Term Loan B and Revolver, and to pay fees and expenses incurred in connection with the Notes offering and the ABL Facility. The Notes and ABL replaced the Term Loan B and Revolver. The Notes mature on June 1, 2024 with interest at 6.75% annually compared to the Term Loan B, which was to mature on March 14, 2020 with interest at LIBOR (subject to a floor of 1.00%) plus 3.50% or Prime rate plus 2.50%. The ABL matures May 19, 2022 as compared to the Revolver, which was set to mature on March 16, 2018. |
| 52 |
| · | On February 28, 2017, we repaid $3.0 million in principal on the Term Loan B and paid interest due as of that date. We recorded a $6,200 pre-tax loss on the early retirement of long-term debt related to the unamortized discount and $18,000 in unamortized debt issuance costs associated with the principal repayment. The reduction in principal of the Term Loan B reduced future interest payments. |
| · | On January 30, 2017, we repaid $2.0 million in principal on the Term Loan B and paid interest due as of that date. We recorded a $4,500 pre-tax loss on the early retirement of long-term debt related to the unamortized discount and $12,000 in unamortized debt issuance costs associated with the principal repayment. The reduction in principal of the Term Loan B reduced future interest payments. |
Acquisitions
| · | On November 22, 2017, we closed on the acquisition of radio station WSPZ-AM (now WWRC-AM) in Bethesda, Maryland for $0.6 million in cash from a related party. |
| · | On September 15, 2017, we closed on the acquisition of real property, including the land, towers and facilities, of radio station WSPZ-AM in Bethesda, Maryland for $1.5 million in cash. |
| · | On August 31, 2017, we acquired the TeacherTube.com website and related assets for $1.1 million in cash. |
| · | On August 31, 2017, we acquired the Intelligence Report newsletter and related assets valued at $2.5 million and we assumed deferred subscription liabilities of $2.9 million. We paid no cash to the seller upon closing. |
| · | On July 24, 2017, we closed on the acquisition of the FM translator construction permit in Eaglemount, Washington, for $40,000 in cash. The FM translator will be relocated to the Portland, Oregon market for use by our KDZR-AM radio station. |
| · | On July 6, 2017, we acquired the TradersCrux.com website and related assets for $0.3 million in cash. As part of the purchase agreement, we may pay up to an additional $0.1 million in contingent earn-out consideration within one year upon the achievement of income benchmarks. Using a probability-weighted discounted cash flow model based on our own assumptions as to the ability of TradersCrux.com to achieve the income targets at the time of closing, we estimated the fair value of the contingent earn-out consideration to be $18,750, which approximates the discounted present value due to the earn-out of less than one year. |
| · | On June 28, 2017, we closed on the acquisition of an FM translator construction permit in Festus, Missouri for $40,000 in cash. The FM translator will be relocated to the St. Louis, Missouri market for use by our KXFN-FM radio station. |
| · | On June 8, 2017, we acquired a Portuguese Bible mobile application for $85,000 in cash. We may pay up to an additional $20,000 in contingent earn-out consideration over the next twelve months based on the achievement of certain revenue benchmarks. |
| · | On March 15, 2017, we acquired the website prayers-for-special-help.com for $0.2 million in cash. |
| · | On March 14, 2017, we closed on the acquisition of an FM translator construction permit in Quartz Site, Arizona for $20,000 in cash. The FM translator will be relocated to the San Diego, California market for use by our KPRZ-AM radio station. |
| · | On March 1, 2017, we closed on the acquisition of an FM translator construction permit in Roseburg, Oregon for $45,000 in cash. The FM translator will be relocated to the Portland, Oregon market for use by our KPDQ-AM radio station. |
| · | On January 16, 2017, we closed on the acquisition of an FM translator in Astoria, Oregon for $33,000 in cash. The FM translator will be relocated to the Seattle, Washington market for use by our KGNW-AM radio station. |
| · | On January 6, 2017, we closed on the acquisition of an FM translator construction permit in Mohave Valley, Arizona for $20,000 in cash. The FM translator will be relocated to the San Diego, California market for use by our KCBQ-AM radio. |
Net Broadcast Revenue
| Year Ended December 31, | ||||||||||||||||||||||||
| 2016 | 2017 | Change $ | Change % | 2016 | 2017 | |||||||||||||||||||
| (Dollars in thousands) | % of Total Net Revenue | |||||||||||||||||||||||
| Net Broadcast Revenue | $ | 202,016 | $ | 196,197 | $ | (5,819 | ) | (2.9 | )% | 73.6 | % | 74.4 | % | |||||||||||
| Same Station Net Broadcast Revenue | $ | 200,415 | $ | 195,485 | $ | (4,930 | ) | (2.5 | )% | |||||||||||||||
| 53 |
The following table shows the dollar amount and percentage of net broadcast revenue for each broadcast revenue source.
| Year Ended December 31, | ||||||||||||||||
| 2016 | 2017 | |||||||||||||||
| (Dollars in thousands) | ||||||||||||||||
| Block program time: | ||||||||||||||||
| National | $ | 49,271 | 24.4 | % | $ | 48,628 | 24.8 | % | ||||||||
| Local | 37,034 | 18.3 | 34,942 | 17.8 | ||||||||||||
| 86,305 | 42.7 | 83,570 | 42.6 | |||||||||||||
| Broadcast Advertising: | ||||||||||||||||
| National | 13,426 | 6.6 | 13,720 | 7.0 | ||||||||||||
| Local | 64,028 | 31.7 | 58,413 | 29.8 | ||||||||||||
| 77,454 | 38.3 | 72,133 | 36.8 | |||||||||||||
| Station Digital | 6,984 | 3.5 | 7,920 | 4.0 | ||||||||||||
| Infomercials | 2,636 | 1.3 | 2,323 | 1.2 | ||||||||||||
| Network | 17,683 | 8.8 | 18,112 | 9.2 | ||||||||||||
| Other Revenue | 10,954 | 5.4 | 12,139 | 6.2 | ||||||||||||
| Net Broadcast Revenue | $ | 202,016 | 100.0 | % | $ | 196,197 | 100.0 | % | ||||||||
In late August 2017, our Houston broadcast market was impacted by Hurricane Harvey and in early September Hurricane Irma impacted our Miami, Tampa and Orlando broadcast markets. We estimate total lost revenues from both storms to be approximately $0.2 million across all broadcast markets impacted, which includes orders cancelled in anticipation of the storms and losses for programs and advertisements that could not broadcast due to the loss of power.
The net decline in block programming revenue of $2.7 million includes a $1.7 million decline on our Christian Teaching and Talk stations, a $0.8 million decline due to the LMA of our Louisville stations, a $0.7 million decline on our Business format stations and a $0.3 million decline from our Spanish language Christian Teaching and Talk stations, which were offset by a $0.8 million increase in programming on our News Talk stations. Declines, particularly from local programming, resulted from cancellations that we believe are due to increased competition from other broadcasters. Declines in national programming revenue reflect the non-renewal of a program that was featured on 19 of our Christian Teaching and Talk stations and declines in business programs as they pursue content that remains in compliance with securities rules and regulations. Our national ministry programs saw an increase of $0.4 million from rate increases of approximately 1.0% to 3.0% partially offset with $0.2 million of cancellations.
Advertising revenue, net of agency commissions, decreased by $5.3 million of which $2.2 million was due to political advertising that was recognized during 2016 based on the elections cycle. The remaining $3.1 million decrease includes a $2.7 million decline in local advertising on our CCM stations, particularly in our Dallas market due to lower ratings and from higher competition from other broadcasters and a $0.9 million decline in local advertising on our Christian Teaching and Talk stations offset by a $0.6 million increase in national advertising on our News Talk stations. Higher competition from other broadcasters and agencies reduce the number of advertisements placed that in turns creates lower demand and lower rates, particularly for unsold spots. We have undertaken efforts to retool our music, imaging and promotions to capture a younger demographic that we believe will improve the ratings for our CCM stations in the Dallas market. We are beginning to see some improved ratings but it will take additional time to turn the improved ratings into improved revenue.
Digital revenue generated from our radio station and network websites increased $0.9 million, which reflects an increase in sales of Salem Consumer Products of $0.4 million, a $0.3 million increase from our News Talk stations and a $0.2 million increase in network digital revenue generated by social media campaigns during the last quarter of the year. We continue to expand our digital product offerings to include social media campaigns, search engine optimization, retargeted advertising and other services to address the move of advertising dollars to digital from broadcasting. The rates charged were comparable to the prior year.
Declines in infomercial revenue reflect our effort to feature programming that is tailored to our audience and consistent with our company values. We continue to seek alternatives to infomercial programs that we believe are not of interest to our audience.
Network revenue increased by $0.4 million, including a $0.6 million increase from a revenue share agreement and a $0.1 million increase in advertising sales with our national talk shows that we believe is attributable to our increased exposure and media presence during the 2016 presidential debates offset by a $0.3 million decrease in political advertising revenue based on the 2016 election cycle.
Other revenue increased $1.2 million due to a $0.7 million increase in listener purchase program revenue associated with vendor discount programs due to higher audience demand, a $0.2 million increase in event revenue due to higher attendance and ticket sales for local events such as concerts and speaking events, a $0.2 million increase in sponsorship revenue in our Atlanta market and a $0.1 million increase in broadcast tower rental fees.
| 54 |
On a Same Station basis, net broadcast revenue decreased $4.9 million, which reflects these items net of the impact of stations that were acquired or are operating under different formats.
Net Digital Media Revenue
| Year Ended December 31, | ||||||||||||||||||||||||
| 2016 | 2017 | Change $ | Change % | 2016 | 2017 | |||||||||||||||||||
| (Dollars in thousands) | % of Total Net Revenue | |||||||||||||||||||||||
| Net Digital Media Revenue | $ | 46,777 | $ | 43,096 | $ | (3,681 | ) | (7.9 | )% | 17.1 | % | 16.3 | % | |||||||||||
The following table shows the dollar amount and percentage of net digital media revenue for each digital media revenue source.
| Year Ended December 31, | ||||||||||||||||
| 2016 | 2017 | |||||||||||||||
| (Dollars in thousands) | ||||||||||||||||
| Digital Advertising, Net | $ | 27,673 | 59.2 | % | $ | 24,566 | 57.0 | % | ||||||||
| Digital Streaming | 4,504 | 9.6 | 4,494 | 10.4 | ||||||||||||
| Digital Subscriptions | 5,996 | 12.8 | 6,580 | 15.3 | ||||||||||||
| Digital Downloads | 5,671 | 12.1 | 5,027 | 11.7 | ||||||||||||
| e-commerce | 2,333 | 5.0 | 2,077 | 4.8 | ||||||||||||
| Other Revenue | 600 | 1.3 | 352 | 0.8 | ||||||||||||
| Net Digital Media Revenue | $ | 46,777 | 100.0 | % | $ | 43,096 | 100.0 | % | ||||||||
On a consolidated basis, digital advertising revenue, net of agency commissions, declined by $3.1 million. This decline was attributable to lower page views on our conservative opinion websites, primarily Townhall Media, as compared to the prior year due to the timing of the 2016 election. Page views for conservative opinion websites are typically higher during election years due to higher level of interest in content, both desktop and mobile. Changes in the Facebook newsfeed algorithm have negatively affected the volume of our desktop page views. Page views from Facebook declined 25.0% as compared to the prior year. To offset declines in page views generated from Facebook, we continue to acquire, develop and promote the use of mobile applications, particularly for our Christian mobile applications. As mobile page views carry fewer advertisements and typically have shorter site visits, our growth in mobile application generated traffic is larger than our growth in revenue from the mobile applications.
Digital streaming revenue was consistent with the prior year with negligible changes in sales volume and rates.
Digital subscription revenue increased by $0.6 million on a consolidated basis. Eagle Financial Publications increased $0.4 million due to higher distribution levels from acquisitions including Retirement Watch in April 2016, Turner Investment Products in September 2016, and Intelligence Reporter in August of 2017, that were partially offset by a decline in the number of subscribers to Skousen’s Fast Money Alert newsletters. Salem Web Network’s Churchstaffing.com increased $0.1 million increased due to increased marketing efforts combined with a re-design of the website. Subscriber rates were comparable to the prior year.
Digital download revenue declined by $0.6 million due to a lower volume of downloads generated as compared to the prior year. Of this decline, $0.4 million was attributable to WorshipHouseMedia.com and $0.2 million was attributable to SermonSpice.com. As users become more adept at creating their own content, declines in downloads of third party produced videos are common. We continue to believe that our content is unique and valuable and that the number of downloads of our content will not be impacted as severely by user created content. In addition, there was a lower volume of downloads as compared to the prior year due in part to content in 2016 that covered the 15th anniversary of the September 11th terrorist attacks. Rates charged to our customers for digital downloads were comparable to the prior year.
E-commerce revenue declined by $0.3 million due to discounts offered on products sold through our wellness website. The average price per unit declined 9% with a 1% decline in the number of products sold. The discounts result from increased competition in the online market place that is driving prices down.
Other revenue includes event revenue, revenue sharing arrangements for purchases made from applications, and mail list rentals. The decrease of $0.2 million reflects the impact of a Townhall and Red State Gathering event held during the third quarter of 2016 leading up to the then presidential election.
Net Publishing Revenue
| Year Ended December 31, | ||||||||||||||||||||||||
| 2016 | 2017 | Change $ | Change % | 2016 | 2017 | |||||||||||||||||||
| (Dollars in thousands) | % of Total Net Revenue | |||||||||||||||||||||||
| Net Publishing Revenue | $ | 25,528 | $ | 24,443 | $ | (1,085 | ) | (4.3 | )% | 9.3 | % | 9.3 | % | |||||||||||
| 55 |
The following table shows the dollar amount and percentage of net publishing revenue for each publishing revenue source.
| Year Ended December 31, | ||||||||||||||||
| 2016 | 2017 | |||||||||||||||
| (Dollars in thousands) | ||||||||||||||||
| Book Sales | $ | 17,022 | 66.7 | % | $ | 18,003 | 73.7 | % | ||||||||
| Estimated Sales Returns & Allowances | (4,482 | ) | (17.6 | ) | (4,340 | ) | (17.8 | ) | ||||||||
| E-Book Sales | 2,213 | 8.7 | 1,817 | 7.4 | ||||||||||||
| Self-Publishing Fees | 6,138 | 24.1 | 5,068 | 20.7 | ||||||||||||
| Print Magazine Subscriptions | 1,503 | 5.9 | 1,164 | 4.8 | ||||||||||||
| Print Magazine Advertisements | 1,027 | 4.0 | 744 | 3.0 | ||||||||||||
| Digital Advertising | 870 | 3.4 | 723 | 3.0 | ||||||||||||
| Other Revenue | 1,237 | 4.8 | 1,264 | 5.2 | ||||||||||||
| Net Publishing Revenue | $ | 25,528 | 100.0 | % | $ | 24,443 | 100.0 | % | ||||||||
On a consolidated basis, book sales increased by $1.0 million due to a $0.9 million increase in book sales from Salem Author Services and a $0.1 million increase in book sales from Regnery Publishing. Regnery Publishing book sales increased 1% in volume and 1% in the average price per unit sold. The $0.9 million increase in book sales generated from Salem Author Services included a $1.0 million increase from Mill City Press, which we acquired on August 1, 2016, offset by a $0.1 million decrease in book sales from Xulon Press™. These results include the impact of Hurricane Irma, which resulted in delays in production due to the loss of power in the Orlando area. We estimate the impact of the hurricane to be approximately $0.3 million of revenue for the year ended December 31, 2017. There were no significant changes in rates charged as compared to the prior year. Sales of books through Regnery Publishing are directly attributable to the number of titles released each period and the composite mix of titles. Revenues can vary significantly based on the book release date and the number of titles that achieve bestseller lists, which can increase awareness and demand for the book.
The $0.1 million decrease in estimated sales returns and allowances resulted from lower sales of Regnery Publishing print books, a reduction in the historical average return rate for Regnery Political books and a reduction to the reserve associated with backlist titles.
Regnery Publishing e-book sales decreased $0.4 million due to a decrease of 23% in the average price per unit sold due to sales incentives offered partially offset with a 3% increase in sales volume. E-book sales can also vary based on the composite mix of titles released and available in each period. Revenues can vary significantly based on the book release date and the number of titles that achieve bestseller lists, which can increase awareness and demand for the book.
Self-publishing fees decreased $1.1 million, which includes a $1.6 million decline in sales volume from Xulon Press™ that was offset by a $0.5 million increase in sales volume from Mill City Press, which was acquired in August 2016. Self-publishing fees charged to authors were comparable with the prior year. We believe that our ability to cross-promote our self-publishing services to authors interested in Regnery Publishing provides us with ongoing growth potential.
Declines in print magazine subscription and print magazine advertising revenue are due to the continual decline within this business and our reduction in the number of print publications produced. We ceased publishing Preaching Magazine™, YouthWorker Journal™, FaithTalk Magazine™ and Homecoming™ The Magazine as of the May 2017 publications due to continual declines in the number of subscribers. Lower demand and distribution levels resulted in corresponding declines in advertising revenues.
Digital adverting revenue decreased $0.2 million primarily due to the closure of the Salem Publishing™ Homecoming website. Following the end of print publications for Preaching Magazine™ and YouthWorker Journal™, the Preaching.com and YouthWorker.com websites are operated within SWN. Sales volume and rates were comparable to the prior year.
Other revenue consists of miscellaneous sources such as change fees, video trailers and website revenues. The increase of $0.1 million was generated by Mill City Press that was acquired on August 1, 2016 offset by a $67,000 decrease in Eagle Regnery revenue due to a decrease in the amount of royalty payments received.
Broadcast Operating Expenses
| Year Ended December 31, | ||||||||||||||||||||||||
| 2016 | 2017 | Change $ | Change % | 2016 | 2017 | |||||||||||||||||||
| (Dollars in thousands) | % of Total Net Revenue | |||||||||||||||||||||||
| Broadcast Operating Expenses | $ | 146,283 | $ | 145,494 | $ | (789 | ) | (0.5 | )% | 53.3 | % | 55.2 | % | |||||||||||
| Same Station Broadcast Operating Expenses | $ | 144,578 | $ | 144,536 | $ | (42 | ) | — | % | |||||||||||||||
Broadcast operating expenses declined by $0.8 million including a $1.4 million reduction in sales-based commissions and incentives consistent with lower revenues, a $0.7 million favorable impact from a litigation matter, a $0.3 million decline in music license fees and a $0.2 million decrease in advertising and promotion costs, that was offset by a $1.2 million increase in bad debt reserves, a $0.5 million increase in payroll-related costs associated with higher personnel levels and annual rate increases, and a $0.2 million increase in non-cash stock-based compensation expense.
| 56 |
On a Same Station basis, broadcast operating expenses decreased by $42,000. The decrease in broadcast operating expenses on a Same Station basis reflects these items net of the impact of start-up costs associated with acquisitions and format changes and the impact of the Louisville market LMA.
Digital Media Operating Expenses
| Year Ended December 31, | ||||||||||||||||||||||||
| 2016 | 2017 | Change $ | Change % | 2016 | 2017 | |||||||||||||||||||
| (Dollars in thousands) | % of Total Net Revenue | |||||||||||||||||||||||
| Digital Media Operating Expenses | $ | 36,290 | $ | 33,675 | $ | (2,615 | ) | (7.2 | )% | 13.2 | % | 12.8 | % | |||||||||||
Digital media operating expenses declined by $2.6 million due to a $1.0 million reduction in sales-based commissions and incentives, a $0.6 million reduction in advertising and promotion costs, a $0.6 million reduction in royalties, a $0.3 million decrease in travel and entertainment costs and a $0.1 million decrease in professional services that were offset by a $0.1 million increase in bad debt expenses.
Publishing Operating Expenses
| Year Ended December 31, | ||||||||||||||||||||||||
| 2016 | 2017 | Change $ | Change % | 2016 | 2017 | |||||||||||||||||||
| (Dollars in thousands) | % of Total Net Revenue | |||||||||||||||||||||||
| Publishing Operating Expenses | $ | 26,209 | $ | 24,475 | $ | (1,734 | ) | (6.6 | )% | 9.6 | % | 9.3 | % | |||||||||||
Publishing operating expenses declined by $1.7 million of which $0.6 million was due to a reduction in the consolidated cost of goods sold. Cost of goods sold declined $0.9 million from Regnery Publishing based a lower number of books sold and declined $0.4 million from Salem PublishingTM due to reductions in the number of print publications produced, that was offset by a $0.6 million increase from Salem Author Services based on the number of books sold. The gross profit margin for Regnery Publishing was 53% for the year ended December 31, 2017 as compared to 46% for the prior year. Regnery Publishing margins are impacted by the volume of e-book sales, which have higher profit margins due to the nature of delivery and lack of sales returns and allowances. The gross profit margin for our self-publishing entities was consistent with the prior year at 29%. Additionally, there was a $1.0 million decline in payroll-related expenses due to reductions in headcount and a $0.2 million decline in travel and entertainment expenses that was offset by a $0.2 million increase in advertising and promotion expenses.
Unallocated Corporate Expenses
| Year Ended December 31, | ||||||||||||||||||||||||
| 2016 | 2017 | Change $ | Change % | 2016 | 2017 | |||||||||||||||||||
| (Dollars in thousands) | % of Total Net Revenue | |||||||||||||||||||||||
| Unallocated Corporate Expenses | $ | 14,994 | $ | 16,255 | $ | 1,261 | 8.4 | % | 5.5 | % | 6.2 | % | ||||||||||||
Unallocated corporate expenses include shared services, such as accounting and finance, human resources, legal, tax and treasury, that are not directly attributable to any one of our operating segments. The net increase of $1.3 million includes a $0.9 million increase in non-cash stock-based compensation charge associated with restricted stock awards and a $0.5 million increase in net payroll-related costs due to higher staffing levels and annual rate increases that were offset by a $0.1 million decrease in professional fees.
Impairment of Long-Lived Assets
| Year Ended December 31, | ||||||||||||||||||||||||
| 2016 | 2017 | Change $ | Change % | 2016 | 2017 | |||||||||||||||||||
| (Dollars in thousands) | % of Total Net Revenue | |||||||||||||||||||||||
| Impairment of Long-Lived Assets | $ | 700 | $ | — | $ | (700 | ) | (100.0 | )% | 0.3 | % | — | % | |||||||||||
Based on changes in management’s planned usage, we classified land in Covina, California as held for sale as of June 2012. At that time, we evaluated the land for impairment in accordance with guidance for impairment of long-lived assets held for sale. We determined that the carrying value of the land exceeded the estimated fair value less costs to sell and recorded an impairment charge of $5.6 million associated with the land based on our estimated sale price at that time. In December 2012, after several purchase offers for the land were terminated, we obtained a third-party valuation for the land. Based on the fair value determined by the third-party, we recorded an additional impairment charge of $1.2 million associated with the land. While we continued to market the land for sale and had no intention to use the land in our operations, we had not received successful offers. Based on the amount of time that the land had been held for sale, we obtained another third-party valuation for the land as of June 2016. Based on this fair value appraisal, we recorded an additional $0.7 million impairment charge associated with the land during the three months ended June 30, 2016. In August 2017, we received an escrow deposit under an agreement to sell the land in Covina, California for $1.0 million dollars. The land is recorded in assets held for sale and has not been used in operations. The sale is subject to the buyer’s ability complete due diligence on their expected use of the land and is currently expected to close in the latter half of 2020.
| 57 |
Impairment of Indefinite-Lived Long-Term Assets Other Than Goodwill
| Year Ended December 31, | ||||||||||||||||||||||||
| 2016 | 2017 | Change $ | Change % | 2016 | 2017 | |||||||||||||||||||
| (Dollars in thousands) | % of Total Net Revenue | |||||||||||||||||||||||
| Impairment of Indefinite-Lived Long-Term Assets Other Than Goodwill | $ | 7,041 | $ | 19 | $ | (7,022 | ) | (99.7 | )% | 2.6 | % | — | % | |||||||||||
Based on management’s plan to cease publishing Preaching Magazine™, YouthWorker Journal™, FaithTalk Magazine™ and Homecoming™. The Magazine upon issuance of the May 2017 issues, we recorded an impairment charge of $19,000 as of March 31, 2017 associated with mastheads.
The impairment charge of $7.0 million for the year ended December 31, 2016 includes $6.5 million of impairments associated with our broadcast licenses and $0.5 million associated with the value of mastheads. These impairments were recognized during our annual testing period in the fourth quarter of 2016. Broadcast licenses were deemed to be impaired in four of the twenty-five markets tested. Impairments were recorded in our Cleveland, Dallas, Detroit and Portland market clusters due to an increase in the risk-adjusted discount rate or WACC. The increase in the WACC for the 2016 testing period as compared to 2015 was largely attributable to increases in corporate borrowing interest rates during 2016 within the composite mix of industry participants considered in the analysis. The impairment charge also includes a $0.5 million charge associated with magazine mastheads due to further reductions in projected net revenues and increases in the WACC. We believe that these impairments are indicative of trends in the industry and are not unique to our company or operations.
Impairment of Goodwill
| Year Ended December 31, | ||||||||||||||||||||||||
| 2016 | 2017 | Change $ | Change % | 2016 | 2017 | |||||||||||||||||||
| (Dollars in thousands) | % of Total Net Revenue | |||||||||||||||||||||||
| Impairment of Goodwill | $ | 32 | $ | — | $ | (32 | ) | (100.0 | )% | — | % | — | % | |||||||||||
During our annual testing period in the fourth quarter of 2016, we noted operating losses and missed projections within our wellness business indicating that the value of goodwill may be impaired. We engaged an independent third-party appraisal and valuation firm to assist us with determining the enterprise value. Based on this review and analysis, we recorded an impairment charge of $32,000 associated with the value of goodwill for Eagle Wellness. This impairment charge resulted from reductions in revenue forecasts for this business due to actual operating results to date that have not met expectations.
Impairment of Amortizable Intangible Assets
| Year Ended December 31, | ||||||||||||||||||||||||
| 2016 | 2017 | Change $ | Change % | 2016 | 2017 | |||||||||||||||||||
| (Dollars in thousands) | % of Total Net Revenue | |||||||||||||||||||||||
| Impairment of Amortizable Intangible Assets | $ | 8 | $ | — | $ | (8 | ) | (100.0 | )% | — | % | — | % | |||||||||||
When performing our review of goodwill associated with our wellness products business during our annual testing in the fourth quarter of 2016, we determined that the carrying value of Eagle Wellness exceeded its fair value. When this occurs, we are required to perform Step 2 of the impairment testing in which we determine the fair value of an entity following the same procedures as a purchase price allocation. Under Step 2, the implied fair value of the reporting unit, including goodwill, was less than the carrying value. We recorded an impairment charge of approximately $8,000 associated with amortizable intangible assets of Eagle Wellness. This impairment charge resulted from reductions in revenue forecasts for this business due to actual operating results to date that have not met expectations.
Depreciation Expense
| Year Ended December 31, | ||||||||||||||||||||||||
| 2016 | 2017 | Change $ | Change % | 2016 | 2017 | |||||||||||||||||||
| (Dollars in thousands) | % of Total Net Revenue | |||||||||||||||||||||||
| Depreciation Expense | $ | 12,205 | $ | 12,369 | $ | 164 | 1.3 | % | 4.4 | % | 4.7 | % | ||||||||||||
Depreciation expense increased $0.2 million compared to the prior year. The increase reflects the impact of recent capital expenditures associated with computer software and office equipment that have shorter estimated useful lives than towers and broadcast assets. There were no changes in our depreciation methods or in the estimated useful lives of our asset groups.
Amortization Expense
| Year Ended December 31, | ||||||||||||||||||||||||
| 2016 | 2017 | Change $ | Change % | 2016 | 2017 | |||||||||||||||||||
| (Dollars in thousands) | % of Total Net Revenue | |||||||||||||||||||||||
| Amortization Expense | $ | 5,071 | $ | 4,593 | $ | (478 | ) | (9.4 | )% | 1.8 | % | 1.7 | % | |||||||||||
| 58 |
The decline in amortization expense reflects the impact of the intangible assets acquired with Eagle Publishing and WorshipHouseMedia.com that were fully amortized as of 2017, compared to generating amortization expense of $1.1 million during the prior year, offset with an increase of $0.6 million in amortization from intangible assets acquired with the acquisitions of King James Bible mobile applications in March 2016, Cycle Prophet in September 2016 and Mill City Press in September 2016. There were no changes in our amortization methods or in the estimated useful lives of our intangible asset groups.
Change in the Estimated Fair Value of Contingent Earn-Out Consideration
| Year Ended December 31, | ||||||||||||||||||||||||
| 2016 | 2017 | Change $ | Change % | 2016 | 2017 | |||||||||||||||||||
| (Dollars in thousands) | % of Total Net Revenue | |||||||||||||||||||||||
| Change in the Estimated Fair Value of Contingent Earn-Out Consideration | $ | (689 | ) | $ | (23 | ) | $ | 666 | (96.7 | )% | (0.3 | )% | — | % | ||||||||||
Our acquisitions may include contingent earn-out consideration as part of the purchase price under which we will make future payments to the seller upon the achievement of certain benchmarks. We review the probabilities of possible future payments to estimate the fair value of any contingent earn-out consideration on a quarterly basis over the earn-out period. Actual results are compared to the estimates and probabilities of achievement used in our forecasts. Should actual results of the acquired business increase or decrease as compared to our estimates and assumptions, the estimated fair value of the contingent earn-out consideration liability will increase or decrease, up to the contracted limit, as applicable.
During the year ended December 31, 2017, we decreased the estimated fair value of our contingent earn-out liabilities by $23,000 compared to a net decrease of $689,000 during the prior year. These changes are based on actual results as compared to the estimates used in our probability analysis for each contingency. Refer to Note 5 of our Consolidated Financial Statements for a detailed analysis of the changes in our assumptions and the impact for each contingency.
Changes in the estimated fair value of the contingent earn-out consideration are reflected in our results of operations in the period in which they are identified. Changes in the estimated fair value of the contingent earn-out consideration may materially impact and cause volatility in our operating results.
Net (Gain) Loss on the Sale or Disposal of Assets
| Year Ended December 31, | ||||||||||||||||||||||||
| 2016 | 2017 | Change $ | Change % | 2016 | 2017 | |||||||||||||||||||
| (Dollars in thousands) | % of Total Net Revenue | |||||||||||||||||||||||
| Net (Gain) Loss on the Sale or Disposal of assets | $ | (1,901 | ) | $ | 3,905 | $ | 5,806 | (305.4 | )% | (0.7 | )% | 1.5 | % | |||||||||||
The net loss on the sale or disposal of assets of $3.9 million for the year ended December 31, 2017 includes a $4.7 million estimated loss on the sale of WQVN-AM (formerly WKAT-AM) in Miami, Florida, a $77,000 loss related to transmitter equipment in Dallas, Texas and a $2,000 net loss for equipment damaged in our Tampa, Florida market as a result of hurricane Irma that was offset by a $0.5 million gain on sale of a former transmitter site in our Dallas, Texas market, a $0.4 million gain on the sale of the WSPZ-AM tower site, and a $16,000 net gain from disposals within our print magazine segment.
The net gain on the sale or disposal of assets of $1.9 million for year ended December 31, 2016 includes a $1.9 million gain on the sale of our Miami tower site and a $0.7 million gain from a land easement in our South Carolina market offset by a $0.4 million charge associated with the relocation of our offices in the Washington D.C. market and net losses of $0.3 million related to various fixed asset disposals.
Other Income (Expense)
| Year Ended December 31, | ||||||||||||||||||||||||
| 2016 | 2017 | Change $ | Change % | 2016 | 2017 | |||||||||||||||||||
| (Dollars in thousands) | % of Total Net Revenue | |||||||||||||||||||||||
| Interest Income | $ | 6 | $ | 4 | $ | (2 | ) | (33.3 | )% | — | % | — | % | |||||||||||
| Interest Expense | (14,938 | ) | (16,706 | ) | (1,768 | ) | 11.8 | % | (5.4 | )% | (6.3 | )% | ||||||||||||
| Change in the Fair Value of Interest Rate Swap | 285 | 357 | 72 | 25.3 | % | 0.1 | % | 0.1 | % | |||||||||||||||
| Gain on Bargain Purchase | 95 | — | (95 | ) | (100.0 | )% | — | % | — | % | ||||||||||||||
| Loss on Early Retirement of Long-Term Debt | (87 | ) | (2,775 | ) | (2,688 | ) | 3,089.7 | % | — | % | (1.1 | )% | ||||||||||||
| Net Miscellaneous Income and (Expenses) | 6 | (80 | ) | (86 | ) | (1,433.3 | )% | — | % | — | % | |||||||||||||
Interest income represents earnings on excess cash and interest due under promissory notes.
Interest expense includes interest due on outstanding debt balances, interest due on our swap agreement prior to termination, and non-cash accretion associated with deferred installments and contingent earn-out consideration associated with our acquisition activity. The increase of $1.8 million reflects the higher interest rate on the Notes outstanding as of the period ending December 31, 2017 as compared to the Term Loan B during the prior year.
| 59 |
The $0.1 million favorable impact of change in the fair value of interest rate swap reflects the mark-to-market impact prior to the termination of our swap agreement on May 19, 2017.
Loss on early retirement of long-term debt reflects $0.6 million of the unamortized discount and $1.5 million of unamortized debt issuance costs associated with the payoff and termination of the Term Loan B on May 19, 2017, $0.1 million of unamortized debt issuance costs associated with the Revolver terminated on May 19, 2017, and $0.6 million to exit and terminate our swap agreement on May 19, 2017, as well as $41,000 of the unamortized discount and unamortized debt issuance costs associated with prior principal redemptions of the Term Loan B.
Net miscellaneous income and expenses includes royalty income and usage fees for real estate properties. During the year ended December 31, 2017, we recorded a non-recurring loss of $78,000 on an investment.
Provision for (Benefit From) Income Taxes
| Year Ended December 31, | ||||||||||||||||||||||||
| 2016 | 2017 | Change $ | Change % | 2016 | 2017 | |||||||||||||||||||
| (Dollars in thousands) | % of Total Net Revenue | |||||||||||||||||||||||
| Provision for (Benefit from) Income Taxes | $ | 4,572 | $ | (20,870 | ) | $ | (25,442 | ) | (556.5 | )% | 1.7 | % | (7.9 | )% | ||||||||||
We recognized a benefit from income taxes of $20.9 million for the year ended December 31, 2017 compared to a tax provision of $4.6 million in the prior year. On December 22, 2017, the Tax Cuts and Jobs Act of 2017 (the “Act”) was signed into law, making significant changes to the Internal Revenue Code. These changes include, but are not limited to, a U.S. corporate tax rate decrease from 35% to 21% effective for tax years beginning after December 31, 2017. We have calculated our best estimate of the impact of the Act in our year end provision for income taxes in accordance with our understanding of the Act and the guidance available as of the date of this filing. As a result, we recorded a $23.0 million additional income tax benefit in the fourth quarter of 2017, the period in which the legislation was enacted, from the remeasurement of deferred tax liabilities associated primarily with intangible assets that are expected to reverse at the new 21% rate in the future.
The change in our provision for income taxes of $25.4 million reflects the $23.0 million impact of the above Act and a $0.8 million increase in the valuation allowance to offset deferred tax assets associated with the state net operating loss carryforwards. The pretax income of $3.8 million was recognized for 2017 compared to $13.4 million for the prior year.
The provision for income taxes as a percentage of income before income taxes, or the effective tax rate was (553.0)% for the year ended December 31, 2017 compared to 34.0% for the prior year. The effective tax rate for each period differs from the federal statutory income rate of 35.0% due to the effect of the Act, state income taxes, certain expenses that are not deductible for tax purposes, and changes in the valuation allowance from the utilization of certain state net operating loss carryforwards.
Net Income (Loss)
| Year Ended December 31, | ||||||||||||||||||||||||
| 2016 | 2017 | Change $ | Change % | 2016 | 2017 | |||||||||||||||||||
| (Dollars in thousands) | % of Total Net Revenue | |||||||||||||||||||||||
| Net Income (Loss) | $ | 8,873 | $ | 24,644 | $ | 15,771 | 177.7 | % | 3.2 | % | 9.3 | % | ||||||||||||
We recognized net income of $24.6 million for the year ended December 31, 2017 compared to $8.9 million in the prior year. The $15.8 million increase includes a $25.5 million decrease in our provision for income taxes offset by $5.1 million decline in net operating income, a $2.7 million increase in loss on the early retirement of long-term debt, and a $1.8 million increase in interest expense.
Year Ended December 31, 2016 compared to the year ended December 31, 2015
The following factors affected our results of operations and our cash flows for the year ended December 31, 2016 as compared to the prior year:
Financing
Throughout the year ended December 31, 2016, we repaid $11.0 million in principal from $274.0 million to $263.0 million on our term loan of $300.0 million (“Term Loan B”) and paid interest through each repayment date compared to principal repayments of $2.0 million, from $276.0 million to $274.0 million, plus interest through each repayment date during the prior year. These reductions in principal of the Term Loan B reduced future interest payments.
| 60 |
Broadcast Acquisitions
We acquired or entered agreements to acquire several FM Translators or FM Translator construction permits during the year. The FCC permits AM and FM radio stations to operate FM Translators. The FCC began an AM Revitalization program, or “AMR,” that included several initiatives intended to benefit AM broadcasters. One of these benefits, intended to promote the use of FM Translators by AM broadcasters, allowed an AM station to relocate one FM translator up to 250 miles from its authorized site and operate the translator on any non-reserved band FM channel in the AM station’s market, subject to coverage and interference rules (“250 Mile Window”). On February 23, 2017, the FCC amended its rules to allow an AM station using a rebroadcasting FM translator to locate the FM translator anywhere within the AM station’s daytime service contour or anywhere within a 25-mile radius of the transmitter, even if the contour extends farther than 25 miles from the transmitter. This rule change will be particularly useful for finding a location for these translators.
On January 29, 2016, the FCC opened a one-time only 250 Mile Window during which only Class C and Class D AM broadcast stations could participate. This window closed on July 28, 2016. A second window opened on July 29, 2016, allowing Class A and Class B AM broadcast stations to participate in addition to any Class C and Class D AM broadcast station that did not participate in the first 250 Mile Window. The second 250 Mile Window closed on October 31, 2016. During these filing windows, qualifying AM stations were able to apply for one new FM translator station, in the non-reserved FM band to be used solely to re-broadcast the AM station’s AM signal to provide fill-in and/or nighttime service. The FM translator must rebroadcast the related AM station for at least four years, not counting any periods of silence.
Construction permits provide authority to construct new FM Translators or make changes in existing facilities. We believe that securing these FM Translators allows us to increase our listening audience by providing enhanced coverage and reach of our existing AM broadcasts that can be heard on FM or expand the listenership of FM HD channels with the potential to create new stations using the HD-2, HD-3 and HD-4 channel capacity.
Our broadcast acquisitions during the year ended December 31, 2016 include the following:
On December 31, 2016, we closed on the acquisition of an FM translator in Aurora, Florida for $50,000 in cash. The FM translator will be used by our WHIM-AM radio station in Miami, Florida.
On December 31, 2016, we closed on the acquisition of an FM translator in Port St. Lucie, Florida for $50,000 in cash. The FM translator will be used by our WLCC-AM radio station in Tampa, Florida.
On December 14, 2016, we closed on the acquisition of an FM translator in Rhinelander, Wisconsin for $50,000 in cash. The FM translator will be used by our WWTC-AM radio station in Minneapolis, Minnesota.
On December 8, 2016, we closed on the acquisition of an FM translator in Little Fish Lake Valley, California for $44,000 in cash. The FM translator will be used by our KFIA-AM radio station in Sacramento, California.
On December 1, 2016, we closed on the acquisition of an FM translator in Lake Placid, Florida for $35,000 in cash. The FM translator will be used by our WTLN-AM radio station in Orlando, Florida.
On November 22, 2016, we closed on the acquisition of two FM translator construction permits in Lahaina, Hawaii and Kihei, Hawaii for $110,000 in cash. The FM translators will be used by our KHNR-AM and KGU-AM radio stations in Honolulu, Hawaii.
On November 22, 2016, we closed on the acquisition of an FM translator in Crested Butte, Colorado for $38,500 in cash. The FM translator will be used by our KZNT-AM radio station in Colorado Springs, Colorado.
On November 21, 2016, we closed on the acquisition of an FM translator in Dansville, New York for $75,000 in cash. The FM translator will be used by our WMCA-AM radio station in New York, New York.
On November 21, 2016, we closed on the acquisition of an FM translator in Carbondale, Pennsylvania for $75,000 in cash. The FM translator will be used by our WPGP-AM radio station in Pittsburgh, Pennsylvania.
On November 11, 2016, we closed on the acquisition of an FM translator construction permit in Kingsville, Texas for $50,000 in cash. The FM translator will be used by our KNTH-AM radio station in Houston, Texas.
On November 7, 2016, we closed on the acquisition of an FM translator in Sebring, Florida for $77,000 in cash. The FM translator was used by our WQVN-AM (formerly WKAT-AM) radio station in Miami, Florida.
On October 20, 2016, we closed on the acquisition of radio station KXFN-AM in St. Louis, Missouri for $190,000 in cash. The station was dark upon closing and launched in December 2016.
On October 20, 2016, we closed on the acquisition of three FM translator construction permits for $155,000 in cash. The FM translator construction permits were based in Angola, Indiana, Cofax, Indiana and Battle Creek, Michigan and will be used by WHK-AM and WHKW-AM, our radio stations in Cleveland, Ohio and WSDZ-AM our radio station in St. Louis, Missouri.
On October 19, 2016, we closed on the acquisition of an FM translator construction permit in Palm Coast, Florida for $65,000 in cash from a related party. The FM translator will be used by our WTWD-AM radio station in Tampa, Florida.
| 61 |
On October 12, 2016, we closed on the acquisition of an FM translator in Lake City, Florida for $65,000 in cash from a related party. The FM translator will be used by our WBZW-AM radio station in Orlando, Florida.
On June 24, 2016, we entered into a LMA to operate radio station KTRB-AM in San Francisco, California beginning on July 1, 2016. On December 15, 2016, we entered into a new LMA to operate this station with East Bay Broadcasting, LLC, a related party.
On June 20, 2016, we closed on the acquisition of an FM translator in the Columbus, Ohio market for $0.3 million in cash. The FM translator is used in our Columbus, Ohio market.
On June 10, 2016, we closed on the acquisition of an FM translator in Amherst, New York for $60,000 in cash. The FM translator is used in our Pittsburgh, Pennsylvania market.
On June 8, 2016, we closed on the acquisition of a construction permit for an FM translator construction permit in Charlotte, Michigan for $50,000 in cash. The FM translator will be used in our Detroit, Michigan market.
On June 3, 2016, we closed on the acquisition of a construction permit for an FM translator in Atwood, Kentucky for $88,000 in cash. The FM translator will be used in our Columbus, Ohio market.
On May 13, 2016, we closed on the acquisition of a construction permit for an FM translator in Kerrville, Texas for $50,000 in cash. The FM translator will be used in our Houston, Texas market.
On May 2, 2016, we closed on the acquisition of an FM translator in Lincoln, Maine for $100,000 in cash. The FM translator is used in our Boston, Massachusetts market.
On April 29, 2016, we closed on the acquisition of a construction permit for an FM translator in Emporia, Kansas for $25,000 in cash. The FM translator will be relocated to Omaha, Nebraska, for use by our KCRO-AM radio station.
Acquisitions – Digital Media
On December 1, 2016, we acquired ChristianConcertAlerts.com for $0.2 million, of which $0.1 million was paid in cash upon close and the remaining $50,000 is due in two installments within the next year.
On October 17, 2016, we purchased Historyonthenet.com and Authentichistory.com for $0.1 million in cash.
On September 13, 2016, we acquired Mike Turner’s line of investment products, including TurnerTrends.com, other domain names and related assets for $0.4 million in cash and the assumption of $0.1 million in deferred subscription liabilities. As part of the purchase agreement, we may pay up to an additional $0.1 million in contingent earn-out consideration over the next twelve months based on the achievement of certain revenue benchmarks.
On April 1, 2016, we acquired the Retirement Watch newsletter and websites for $0.1 million in cash and the assumption of $0.6 million in deferred subscription liabilities.
On March 8, 2016, we acquired King James Bible mobile applications for $4.0 million, of which $2.7 million was paid in cash upon close and $1.3 million is due in deferred installments within one year from the closing date.
During the year ended December 31, 2016, we acquired other domain names and assets associated within our digital media operating segment for approximately $3,000 in cash.
Acquisitions – Publishing
On August 1, 2016, we acquired the assets of Hillcrest Media Group, Inc., including Mill City Press and Bookprinting.com, for $3.5 million and the assumption of $1.0 million in deferred revenue liabilities. We paid $3.3 million in cash upon close with the remaining $0.2 million due within 90 days upon the finalization of deferred revenue obligations.
During the year ended December 31, 2016, we acquired other domain names and assets associated within our publishing operating segment for approximately $3,000 in cash.
Divestitures
| · | In November 2016, we entered an agreement with Word Broadcasting Network to transfer the operation of our Louisville radio stations (WFIA-AM; WFIA-FM; WGTK-AM) under a twenty-four month TBA effective as of January 3, 2017. We received $0.5 million of cash from Word Broadcasting Network associated with an option for them to purchase these stations. |
| · | On September 1, 2016, we received $0.7 million in cash associated with a land easement granted in our South Carolina market. |
| 62 |
| · | On June 10, 2016, we received $2.5 million in cash from the National Park Service in exchange for its claim under eminent domain for our tower site in Miami, Florida. We recognized a pre-tax gain of $1.9 million from this sale. We entered a limited terms of use agreement with the National Park Service to broadcast from the tower site for the next twenty years for a nominal fee. |
Net Broadcast Revenue
| Year Ended December 31, | ||||||||||||||||||||||||
| 2015 | 2016 | Change $ | Change % | 2015 | 2016 | |||||||||||||||||||
| (Dollars in thousands) | % of Total Net Revenue | |||||||||||||||||||||||
| Net Broadcast Revenue | $ | 197,184 | $ | 202,016 | $ | 4,832 | 2.5 | % | 74.2 | % | 73.6 | % | ||||||||||||
| Same Station Net Broadcast Revenue | $ | 196,972 | $ | 199,379 | $ | 2,407 | 1.2 | % | ||||||||||||||||
The following table shows the dollar amount and percentage of net broadcast revenue for each broadcast revenue source.
| Year Ended December 31, | ||||||||||||||||
| 2015 | 2016 | |||||||||||||||
| (Dollars in thousands) | ||||||||||||||||
| Block program time: | ||||||||||||||||
| National | $ | 46,401 | 23.5 | % | $ | 49,271 | 24.4 | % | ||||||||
| Local | 36,156 | 18.3 | 37,034 | 18.3 | ||||||||||||
| 82,557 | 41.9 | 86,305 | 42.7 | |||||||||||||
| Advertising: | ||||||||||||||||
| National | 13,939 | 7.1 | 13,426 | 6.6 | ||||||||||||
| Local | 63,375 | 32.1 | 64,028 | 31.7 | ||||||||||||
| 77,314 | 39.2 | 77,454 | 38.3 | |||||||||||||
| Digital | 6,680 | 3.4 | 6,984 | 3.5 | ||||||||||||
| Infomercials | 2,545 | 1.3 | 2,636 | 1.3 | ||||||||||||
| Network | 15,010 | 7.6 | 17,683 | 8.8 | ||||||||||||
| Other | 13,078 | 6.6 | 10,954 | 5.4 | ||||||||||||
| Net broadcast revenue | $ | 197,184 | 100.0 | % | $ | 202,016 | 100.0 | % | ||||||||
Block programming revenue increased $3.7 million of which $1.1 million was generated from stations that we acquired late in 2015, many of which we began programming in January 2016. On existing stations, we saw increases in the number of national and local programmers featured on our stations that often creates a higher demand for certain time slots. This increase in demand can result in the realization of higher rates. Our Christian Teaching and Talk stations generated a $1.4 million increase in programming revenues of which $1.3 million was from national programs. Programming revenue on our News Talk stations increased $0.9 million of which $0.3 million was generated from launching a local program onto our national platform. The remaining $0.3 million increase was generated from our Spanish Christian Teaching and Talk and Business News format stations.
Advertising revenue, net of agency commissions, increased by $0.1 million including a $2.3 million increase in political advertising. Net of political advertising, the net decrease in advertising revenue of $2.2 million was due to a $3.5 million decline in advertising on our CCM stations, particularly in our Dallas market due to higher competition for advertising sales from agencies and what we believe to be a shift in advertisers toward a younger demographic. In response to these trends, we have undertaken efforts to retool our music, image and promotions to capture more of that audience. The decline in advertising on our CCM stations was partially offset with a $0.7 million increase from our News Talk stations, a $0.3 million increase from our Business stations and a $0.2 million increase from our Spanish Christian Teaching and Talk stations. Our stations, particularly our News Talk format, benefited from a higher demand for airtime associated with news and related content from the 2016 presidential election cycle. This higher demand for airtime results in higher spot rates for premium airtime.
Digital revenue generated from our radio station websites increased $0.3 million, primarily from our News Talk Stations. Digital revenues were favorably impacted by higher demand and higher page views associated with news and related content from the 2016 presidential election cycle. Rates charged were consistent with those during the prior year.
Infomercial revenue increased $0.1 million due to a higher number of placements on our Christian Teaching and Talk stations. We have seen declining infomercial revenues in recent years due to our efforts to feature programming that is tailored to our listeners and consistent with our company values. While we continue to seek alternatives to infomercial programs that we believe are not of interest to our listeners, we may continue to place programs that are categorized as infomercials.
Network revenue increased by $2.7 million including a $2.9 million increase in advertising sales through our network, of which $0.2 million was due to political advertising. This increase was offset by a $0.2 million decline in event revenue due to a special listener event held in 2015 that included our network hosts on a historical tour.
| 63 |
Other revenues declined by $2.1 million due to a $1.4 million decline in listener purchase program revenue due to a lower demand from our audience with respect to participation in sales incentives and discount programs and a $0.7 million decline in event revenue due to lower ticket sales and attendance primarily due to weather related conditions during outdoor summer events.
On a Same Station basis, net broadcast revenue increased $2.4 million, which reflects these items net of the impact of stations with acquisitions and format changes.
Net Digital Media Revenue
| Year Ended December 31, | ||||||||||||||||||||||||
| 2015 | 2016 | Change $ | Change % | 2015 | 2016 | |||||||||||||||||||
| (Dollars in thousands) | % of Total Net Revenue | |||||||||||||||||||||||
| Net Digital Media Revenue | $ | 44,761 | $ | 46,777 | $ | 2,016 | 4.5 | % | 16.8 | % | 17.1 | % | ||||||||||||
The following table shows the dollar amount and percentage of net digital media for each digital media revenue source.
| Year Ended December 31, | ||||||||||||||||
| 2015 | 2016 | |||||||||||||||
| (Dollars in thousands) | ||||||||||||||||
| Digital Advertising, Net | $ | 24,843 | 55.5 | % | $ | 27,673 | 59.2 | % | ||||||||
| Digital Streaming | 4,472 | 10.0 | 4,504 | 9.6 | ||||||||||||
| Digital Subscriptions | 6,227 | 13.9 | 5,996 | 12.8 | ||||||||||||
| Digital Downloads | 5,925 | 13.3 | 5,671 | 12.1 | ||||||||||||
| e-commerce | 2,568 | 5.7 | 2,333 | 5.0 | ||||||||||||
| Other Revenue | 726 | 1.6 | 600 | 1.3 | ||||||||||||
| Net Digital Media Revenue | $ | 44,761 | 100.0 | % | $ | 46,777 | 100.0 | % | ||||||||
Digital advertising revenue, net of agency commissions, increased $2.8 million on a consolidated basis of which $0.6 million was due to political-based advertising revenue. Salem Web Network generated a $1.5 million increase in net digital advertising revenue while our conservative option websites within Townhall Media generated a $0.7 million increase in net digital advertising revenue. These increases resulted from growth in page views including growth in page views generated from the use of mobile applications.
While changes in the Facebook newsfeed algorithm negatively impacted the volume of our desktop page views, we have been developing and promoting the use of mobile applications. The increases in traffic to our websites that we have observed to date are largely due to increases in the number of visits and in the number of Christian mobile applications available. The growth in traffic from mobile applications reduces our reliance on Facebook to generate traffic. One important note about this shift in traffic to mobile applications and away from desktop and tablet is that there are far fewer ads on mobile and visits are much shorter. As a result, our growth in traffic is larger than our growth in revenue.
Digital streaming revenue increased slightly as compared to the prior year based on higher usage of content available on our Christian websites. The rates charged were consistent with those of the prior year.
Digital subscription revenue declined by $0.2 million due to lower distribution levels of Eagle Financial Publications. The stock market performance during 2016, particularly the drop in the market during January 2016, along with uncertainty with the presidential election, negatively impacted the demand for these products. There were no changes in subscriber rates during this period.
Digital download revenue decreased $0.2 million due to a lower volume of downloads generated as compared to the prior year. Of this decrease, $0.1 million was generated from WorshipHouseMedia.com and $0.1 million was generated from SermonSpice.com. There were no changes in rates charged to our customers for digital downloads.
E-commerce revenue includes sales of wellness products through Eagle Wellness and Gene Smart. Sales of Eagle Wellness products declined by $0.3 million and were partially offset with an increase in products sold under the Gene Smart line of $0.1 million. The net decline was due to a 5% reduction in the number of products sold with no change in the retail prices. However, based on the composite mix of products sold, there was a 5% reduction in the average unit price per unit.
Net Publishing Revenue
| Year Ended December 31, | ||||||||||||||||||||||||
| 2015 | 2016 | Change $ | Change % | 2015 | 2016 | |||||||||||||||||||
| (Dollars in thousands) | % of Total Net Revenue | |||||||||||||||||||||||
| Net Publishing Revenue | $ | 23,842 | $ | 25,528 | $ | 1,686 | 7.1 | % | 9.0 | % | 9.3 | % | ||||||||||||
| 64 |
The following table shows the dollar amount and percentage of net publishing revenue for each publishing revenue source.
| Year Ended December 31, | ||||||||||||||||
| 2015 | 2016 | |||||||||||||||
| (Dollars in thousands) | ||||||||||||||||
| Book Sales | $ | 17,967 | 75.4 | % | $ | 17,022 | 66.7 | % | ||||||||
| Estimated Sales Returns & Allowances | (6,404 | ) | (26.9 | ) | (4,482 | ) | (17.6 | ) | ||||||||
| E-Book Sales | 1,970 | 8.3 | 2,213 | 8.7 | ||||||||||||
| Self-Publishing Fees | 5,406 | 22.7 | 6,138 | 24.1 | ||||||||||||
| Print Magazine Subscriptions | 1,655 | 6.9 | 1,503 | 5.9 | ||||||||||||
| Print Magazine Advertisements | 1,075 | 4.5 | 1,027 | 4.0 | ||||||||||||
| Digital Advertising | 939 | 3.9 | 870 | 3.4 | ||||||||||||
| Other Revenue | 1,234 | 5.2 | 1,237 | 4.8 | ||||||||||||
| Net Publishing Revenue | $ | 23,842 | 100.0 | % | $ | 25,528 | 100.0 | % | ||||||||
On a consolidated basis, sales of print books decreased by $0.9 million comprised of a $1.6 million decline in book sales from Regnery Publishing that were offset by a $0.7 million increase in book sales to authors through our self-publishing services. The $0.7 million increase in book sales generated from self-publishing services included a $1.1 million increase due to activity from our newly acquired publisher Mill City Press, that was offset by a $0.4 million decline in book sales from Xulon Press™. There were no changes in rates charged as compared to the prior year. Book sales generated by Regnery Publishing are directly attributable to the composite mix of titles released and available in each period. Revenues can vary significantly based on the book release date and the number of titles that achieve the New York Times bestseller list, which can increase awareness and demand for the book. The $1.9 million decrease in estimated sales returns and allowances was due to a decline in print book sales from Regnery Publishing and a reduction of the previously recorded reserve of $0.3 million associated with titles published in 2014 for which actual returns were less than the original estimates.
E-book sales from Regnery Publishing increased $0.2 million based on a higher volume of books sold as compared to the prior year. Similar to the sale of books in print, e-book sales are also directly attributable to the composite mix of titles available in each period. Revenues can vary significantly based on the book release date and the number of titles that achieve the New York Times bestseller list, which can increase awareness and demand for the book.
Self-publishing fees increased $0.7 million due to growth in the number of authors utilizing Salem Author Services, including $0.4 million generated from our newly acquired publisher Mill City Press and $0.3 million generated from Xulon Press™. There were no changes in fees as compared to the prior year. We believe that our ability to cross-promote our self-publishing services to authors interested in Regnery Publishing provides us with ongoing growth potential. We believe that our acquisition of Mill City Press, a self-publishing service provider for all authors, also increases our ability to cross-promote our publishing services. Mill City Press is a “tuck-in” acquisition that will transition its operations, including Bookprinting.com, within our existing Xulon Press™ management team and facility, collectively referred to as Salem Author Services.
Print magazine revenue continues to decline with a $0.2 million reduction in subscription revenue based on a lower number of subscribers and a $0.2 million decline in print magazine advertisements and digital advertising due to reduced demand from advertisers and reduced rates based on the lower subscriber levels as compared to the prior year. We continue to explore cost reductions in this segment to offset the eroding revenue base.
Broadcast Operating Expenses
| Year Ended December 31, | ||||||||||||||||||||||||
| 2015 | 2016 | Change $ | Change % | 2015 | 2016 | |||||||||||||||||||
| (Dollars in thousands) | % of Total Net Revenue | |||||||||||||||||||||||
| Broadcast Operating Expenses | $ | 140,819 | $ | 146,283 | $ | 5,464 | 3.9 | % | 53.0 | % | 53.3 | % | ||||||||||||
| Same Station Broadcast Operating Expenses | $ | 140,487 | $ | 143,298 | $ | 2,811 | 2.0 | % | ||||||||||||||||
Broadcast operating expenses increased by $5.5 million of which $2.5 million relates to operating expenses for stations acquired during 2015 that are included in 2016 operations for the full year. The increase also includes a $3.0 million increase in payroll-related costs due to higher staffing levels and sales-based commissions associated with higher revenues and a $0.5 million increase in benefit costs due to higher value claims under our health insurance plan, a $0.5 million charge associated with a contract litigation matter and $0.5 million increase in travel expenses that include a corporate-sponsored conference. The corporate sponsored conference was held in January 2016 and featured our local and national talk show hosts focusing on opportunities with the upcoming political elections. These increases were partially offset by a $0.7 million decline in bad debt expense due to an increase in collection efforts and a $0.2 million decline in professional services. The increase in broadcast operating expenses on a Same Station basis reflects these items net of the impact of start-up costs associated with acquisitions and format changes.
| 65 |
Digital Media Operating Expenses
| Year Ended December 31, | ||||||||||||||||||||||||
| 2015 | 2016 | Change $ | Change % | 2015 | 2016 | |||||||||||||||||||
| (Dollars in thousands) | % of Total Net Revenue | |||||||||||||||||||||||
| Digital Media Operating Expenses | $ | 35,380 | $ | 36,290 | $ | 910 | 2.6 | % | 13.3 | % | 13.2 | % | ||||||||||||
The $0.9 million increase in digital media operating expenses includes a $0.4 million increase in payroll-related costs across all business units based on higher staffing levels and higher sales based commissions and bonuses, a $0.1 million increase in employee benefit costs due to an increase in higher value claims under our health insurance plan, a $0.6 million increase in streaming expenses due to a higher usage volume primarily from Townhall Media, and a $0.1 million increase in professional services that were partially offset with $0.2 million in savings realized from lower rent costs due to consolidation of the Townhall Media facility.
Publishing Operating Expenses
| Year Ended December 31, | ||||||||||||||||||||||||
| 2015 | 2016 | Change $ | Change % | 2015 | 2016 | |||||||||||||||||||
| (Dollars in thousands) | % of Total Net Revenue | |||||||||||||||||||||||
| Publishing Operating Expenses | $ | 24,774 | $ | 26,209 | $ | 1,435 | 5.8 | % | 9.3 | % | 9.6 | % | ||||||||||||
Publishing operating expenses reflect a $0.5 million increase in the cost of goods sold associated with book sales generated through Salem Author Services. The gross profit margin for our self-publishing entities was consistent at 71% for each of the years ended December 31, 2016 and 2015. The gross profit margin for Regnery Publishing was 46% for the year ended December 31, 2016 compared to 42% for the prior year. Cost of goods sold for Regnery Publishing improves with sale of e-books, which have a lower cost of goods sold due to the nature of delivery and no sales returns.
Our newly acquired publisher Mill City Press generated approximately $1.5 million of operating expenses including salary, advertising and promotional costs, and facility related costs. These costs were partially offset with a $0.4 million decline in advertising and promotions with Regnery Publishing and a $0.2 million decline in operating costs from our print magazine segment due to cost saving initiatives.
Unallocated Corporate Expenses
| Year Ended December 31, | ||||||||||||||||||||||||
| 2015 | 2016 | Change $ | Change % | 2015 | 2016 | |||||||||||||||||||
| (Dollars in thousands) | % of Total Net Revenue | |||||||||||||||||||||||
| Unallocated Corporate Expenses | $ | 15,146 | $ | 14,994 | $ | (152 | ) | (1.0 | )% | 5.7 | % | 5.5 | % | |||||||||||
Unallocated corporate expenses include shared services, such as accounting and finance, human resources, legal, tax and treasury, that are not directly attributable to any one of our operating segments. The net decrease of $0.2 million includes a $1.2 million reduction in accrued management bonuses and a $0.1 million decrease in non-cash stock-based compensation expense that were partially offset by a $0.1 million increase in employee benefit costs due to an increase in higher value claims under our health insurance plan, a $0.6 million increase in professional fees associated with legal and accounting services and a $0.5 million increase in net payroll-related costs due to higher staffing levels associated with acquisitions and growth.
Depreciation Expense
| Year Ended December 31, | ||||||||||||||||||||||||
| 2015 | 2016 | Change $ | Change % | 2015 | 2016 | |||||||||||||||||||
| (Dollars in thousands) | % of Total Net Revenue | |||||||||||||||||||||||
| Depreciation Expense | $ | 12,417 | $ | 12,205 | $ | (212 | ) | (1.7 | )% | 4.7 | % | 4.4 | % | |||||||||||
There were no changes in our depreciation methods or in the estimated useful lives of our asset groups. The decline in depreciation of $0.2 million reflects the impact of computer software acquired during the year ended December 31, 2012 that was fully depreciated during the year ended December 31, 2016, compared to generating depreciation expense of $0.5 million during the prior year as well as the composite mix of other capital expenditures incurred.
Amortization Expense
| Year Ended December 31, | ||||||||||||||||||||||||
| 2015 | 2016 | Change $ | Change % | 2015 | 2016 | |||||||||||||||||||
| (Dollars in thousands) | % of Total Net Revenue | |||||||||||||||||||||||
| Amortization Expense | $ | 5,324 | $ | 5,071 | $ | (253 | ) | (4.8 | )% | 2.0 | % | 1.8 | % | |||||||||||
There were no changes in our amortization methods or in the estimated useful lives of our intangible asset groups. The decline in amortization expense of $0.3 million reflects the impact of customer lists and contracts acquired with Eagle Publishing that were fully amortized as of the year ended December 31, 2016, compared to generating amortization expense of $1.0 million during the prior year that were offset with the amortization of intangible assets acquired with King James Bible in March 2016 and Mill City Press in September 2016.
| 66 |
Change in the Estimated Fair Value of Contingent Earn-Out Consideration
| Year Ended December 31, | ||||||||||||||||||||||||
| 2015 | 2016 | Change $ | Change % | 2015 | 2016 | |||||||||||||||||||
| (Dollars in thousands) | % of Total Net Revenue | |||||||||||||||||||||||
| Change in the Estimated Fair Value of Contingent Earn-Out Consideration | $ | (1,715 | ) | $ | (689 | ) | $ | 1,026 | (59.8 | )% | (0.6 | )% | (0.3 | )% | ||||||||||
Our acquisitions may include contingent earn-out consideration as part of the purchase price under which we will make future payments to the seller upon the achievement of certain benchmarks. We review the probabilities of possible future payments to estimate the fair value of any contingent earn-out consideration on a quarterly basis over the earn-out period. Actual results are compared to the estimates and probabilities of achievement used in our forecasts. Should actual results of the acquired business increase or decrease as compared to our estimates and assumptions, the estimated fair value of the contingent earn-out consideration liability will increase or decrease, up to the contracted limit, as applicable.
For the year ended December 31, 2016, we recorded a net reduction in our contingent earn-out liabilities of $0.7 million compared to $1.7 million for the prior year. The changes were based on actual results as compared to the estimates used in our probability analysis for each contingency. Refer to Note 5 in the notes to our Consolidated Financial Statements contained in Item 8 of this annual report on Form 10-K for a detailed analysis of the changes in our assumptions and the impact for each contingency.
Changes in the estimated fair value of the contingent earn-out consideration are reflected in our results of operations in the period in which they are identified. Changes in the estimated fair value of the contingent earn-out consideration may materially impact and cause volatility in our operating results.
Impairment of Indefinite-Lived Long-Term Assets Other Than Goodwill
| Year Ended December 31, | ||||||||||||||||||||||||
| 2015 | 2016 | Change $ | Change % | 2015 | 2016 | |||||||||||||||||||
| (Dollars in thousands) | % of Total Net Revenue | |||||||||||||||||||||||
| Impairment of Indefinite-Lived Long-Term Assets Other Than Goodwill | $ | — | $ | 7,041 | $ | 7,041 | 100.0 | % | — | % | 2.6 | % | ||||||||||||
The impairment charge of $7.0 million includes $6.5 million of impairments associated with our broadcast licenses and $0.5 million associated with the value of mastheads. These impairments were recognized during our annual testing period in the fourth quarter of 2016. Broadcast licenses were deemed to be impaired in four of the twenty-five markets tested. Impairments were recorded in our Cleveland, Dallas, Detroit and Portland market clusters due to an increase in the risk-adjusted discount rate or WACC. The increase in the WACC for the 2016 testing period as compared to 2015 was largely attributable to increases in corporate borrowing interest rates during 2016 within the composite mix of industry participants considered in the analysis. The impairment charge also includes a $0.5 million charge associated with magazine mastheads due to further reductions in projected net revenues and increases in the WACC. We believe that these impairments are indicative of trends in the industry and are not unique to our company or operations.
Impairment of Goodwill
| Year Ended December 31, | ||||||||||||||||||||||||
| 2015 | 2016 | Change $ | Change % | 2015 | 2016 | |||||||||||||||||||
| (Dollars in thousands) | % of Total Net Revenue | |||||||||||||||||||||||
| Impairment of Goodwill | $ | 439 | $ | 32 | $ | (407 | ) | (92.7 | )% | 0.2 | % | — | % | |||||||||||
During our annual testing period in the fourth quarter of 2016, we noted operating losses and missed projections within our wellness business indicating that the value of goodwill may be impaired. We engaged an independent third-party appraisal and valuation firm to assist us with determining the enterprise value. Based on this review and analysis, we recorded an impairment charge of $32,000 associated with the value of goodwill for Eagle Wellness. This impairment charge resulted from reductions in revenue forecasts for this business due to actual operating results to date that have not met expectations.
For our annual testing as of the fourth quarter of 2015, we identified operating losses within our Singing News Network that indicated that the value of goodwill may be impaired. We engaged an independent third-party appraisal and valuation firm to assist us with determining the enterprise value. Based on this review and analysis, we recorded an impairment charge of $0.4 million associated with the value of goodwill for the Singing News Network. We believe that this impairment is indicative of trends in the industry and is not unique to our company or operations.
Impairment of Amortizable Intangible Assets
| Year Ended December 31, | ||||||||||||||||||||||||
| 2015 | 2016 | Change $ | Change % | 2015 | 2016 | |||||||||||||||||||
| (Dollars in thousands) | % of Total Net Revenue | |||||||||||||||||||||||
| Impairment of Amortizable Intangible Assets | $ | — | $ | 8 | $ | 8 | 100.0 | % | — | % | — | % | ||||||||||||
| 67 |
When performing our review of goodwill associated with our wellness products business during our annual testing in the fourth quarter of 2016, we determined that the carrying value of Eagle Wellness exceeded its fair value. When this occurs, we are required to perform Step 2 of the impairment testing in which we determine the fair value of an entity following the same procedures as a purchase price allocation. Under Step 2, the implied fair value of the reporting unit, including goodwill, was less than the carrying value. We recorded an impairment charge of approximately $8,000 associated with amortizable intangible assets of Eagle Wellness. This impairment charge resulted from reductions in revenue forecasts for this business due to actual operating results to date that have not met expectations.
Impairment of Long-Lived Assets
| Year Ended December 31, | ||||||||||||||||||||||||
| 2015 | 2016 | Change $ | Change % | 2015 | 2016 | |||||||||||||||||||
| (Dollars in thousands) | % of Total Net Revenue | |||||||||||||||||||||||
| Impairment of Long-Lived Assets | $ | — | $ | 700 | $ | 700 | 100.0 | % | — | % | 0.3 | % | ||||||||||||
We recorded a $0.7 million impairment charge associated with the fair value of land in Covina, California. Based on changes in management’s planned usage, we classified this land as held for sale as of June 2012. While we continue to market the land for sale and have no intention to use the land in our operations, we have not received successful purchase offers for the land. Due to the amount of time that the land has been held for sale, we obtained a third-party valuation for the land as of June 2016. We reduced the value of the land based on this fair value appraisal. Previously recognized impairment charges for this land were $5.6 million in June 2012 and $1.2 million in December 2012.
(Gain) Loss on the Sale or Disposal of Assets
| Year Ended December 31, | ||||||||||||||||||||||||
| 2015 | 2016 | Change $ | Change % | 2015 | 2016 | |||||||||||||||||||
| (Dollars in thousands) | % of Total Net Revenue | |||||||||||||||||||||||
| (Gain) Loss on the Sale or Disposal of Assets | $ | 181 | $ | (1,901 | ) | $ | (2,082 | ) | (1,150.3 | )% | 0.1 | % | (0.7 | )% | ||||||||||
The net gain on the sale or disposal of assets of $1.9 million for the year ended December 31, 2016 includes a $1.9 million gain on the sale of our Miami tower site and $0.7 million gain from a land easement in our South Carolina market offset by a $0.4 million charge associated with leasehold improvements that were abandoned during the relocation of our offices in the Washington, D.C. market and various fixed asset disposals.
The net loss on the sale or disposal of assets for the year ended December 31, 2015 includes a $0.2 million charge associated with the relocation of our office and studio in our Seattle, Washington market offset by proceeds from various fixed asset and equipment disposals.
Other Income (Expense)
| Year Ended December 31, | ||||||||||||||||||||||||
| 2015 | 2016 | Change $ | Change % | 2015 | 2016 | |||||||||||||||||||
| (Dollars in thousands) | % of Total Net Revenue | |||||||||||||||||||||||
| Interest income | $ | 8 | $ | 6 | $ | (2 | ) | (25.0 | )% | — | % | — | % | |||||||||||
| Interest Expense, net of Capitalized Interest | (15,429 | ) | (14,938 | ) | 491 | (3.2 | )% | (5.8 | )% | (5.4 | )% | |||||||||||||
| Change in the Fair Value of Interest Rate Swap | (1,273 | ) | 285 | 1,558 | (122.4 | )% | (0.5 | )% | 0.1 | % | ||||||||||||||
| Gain on Bargain Purchase | 1,357 | 95 | (1,262 | ) | (93.0 | )% | 0.5 | % | — | % | ||||||||||||||
| Loss on Early Retirement of Long-Term Debt | (41 | ) | (87 | ) | (46 | ) | 112.2 | % | — | % | — | % | ||||||||||||
| Net Miscellaneous Income and (Expenses) | 201 | 6 | (195 | ) | (97.0 | )% | 0.1 | % | — | % | ||||||||||||||
Interest income represents earnings on excess cash and interest due under promissory notes.
Interest expense includes interest due on outstanding debt balances, interest due on our swap agreement and non-cash interest accretion related to deferred payments related to our acquisition activity and from our contingent earn-out consideration. The $0.5 million decline in interest expense is due to a lower principal balance outstanding on our Term Loan B and a lower average outstanding balance on our Revolver.
The change in the fair value of interest rate swap reflects the mark-to-market fair value adjustment of the interest rate swap agreement that was entered into on March 28, 2013.
In accordance with the Financial Accounting Standards Board (“FASB”) Accounting Standards Codification (“ASC”) Topic 805 Business Combinations, any excess of fair value of the acquired net assets over the acquisition consideration shall be recognized as a gain on a bargain purchase. Prior to recording a gain, the acquiring entity must reassess whether all acquired assets and assumed liabilities have been identified and recognized and perform re-measurements to verify that the consideration paid, assets acquired, and liabilities assumed have been properly valued. We underwent such a reassessment, and as a result, have recorded a gain on bargain purchase for KXFN-AM in St. Louis, Missouri, of $0.1 million. If new information is obtained during the measurement period about facts and circumstances that existed as of the acquisition date that, if known, would have affected the measurement of the amounts recognized for assets acquired and liabilities assumed, we will adjust the amounts recognized as of the acquisition date.
| 68 |
During the prior year, we recorded a pre-tax gain on the bargain purchase for WSDZ-AM in St. Louis, Missouri, of $0.8 million, for KDIZ-AM in Minneapolis, Minnesota, of $0.3 million and for WWMI-AM in Tampa, Florida, of $0.3 million. We believed that the gain on bargain purchase resulted from various factors that impacted the acquisition price, including, without limitation, Disney’s plan to exit the broadcasting business and divest its Radio Disney properties.
The loss on early retirement of long-term debt reflects the unamortized discount and bank loan fees associated with principal redemptions of our Term Loan B.
Net miscellaneous income and expenses includes royalty income, usage fees for our real estate properties and insurance proceeds.
Provision for Income Taxes
| Year Ended December 31, | ||||||||||||||||||||||||
| 2015 | 2016 | Change $ | Change % | 2015 | 2016 | |||||||||||||||||||
| (Dollars in thousands) | % of Total Net Revenue | |||||||||||||||||||||||
| Provision for Income Taxes | $ | 6,695 | $ | 4,572 | $ | (2,123 | ) | (31.7 | )% | 2.5 | % | 1.7 | % | |||||||||||
The decrease in our provision for income taxes of $2.1 million reflects the impact of pre-tax income of $13.4 million recognized during the year ended December 31, 2016 compared to $17.8 million for the prior year and a $1.6 million out-of-period adjustment to correct an error in our estimated valuation allowance for certain deferred tax assets related to state net operating loss carryforwards that we determined were not more likely than not to be realized that was recorded in September 2016. The provision for income taxes as a percentage of income before income taxes, or the effective tax rate, was 34.0% for the year ended December 31, 2016 compared to 37.5% for the prior year. The effective tax rate for each period differs from the federal statutory income rate of 35.0% due to the effect of state income taxes, certain expenses that are not deductible for tax purposes and changes in the valuation allowance related to the utilization of certain state net operating loss carryforwards.
Net Income
| Year Ended December 31, | ||||||||||||||||||||||||
| 2015 | 2016 | Change $ | Change % | 2015 | 2016 | |||||||||||||||||||
| (Dollars in thousands) | % of Total Net Revenue | |||||||||||||||||||||||
| Net Income | $ | 11,150 | $ | 8,873 | $ | (2,277 | ) | (20.4 | )% | 4.2 | % | 3.2 | % | |||||||||||
Our net income declined by $2.3 million to $8.9 million for the year ended December 31, 2016 compared to $11.2 million during the prior year. This decline reflects the impact of $7.8 million of impairment charges in 2016 compared to $0.4 million in the prior year and an increase in operating expenses of $7.7 million, that were partially offset by an $8.5 million increase in net revenue and the $2.1 million favorable impact of gains on the sale or disposal of assets in 2016.
CRITICAL ACCOUNTING POLICIES, JUDGMENTS AND ESTIMATES
The discussion and analysis of our financial condition and results of operations are based upon our Consolidated Financial Statements, which have been prepared in accordance with GAAP. The preparation of these financial statements requires management to make estimates and judgments that affect the reported amounts of assets, liabilities, revenues and expenses, and related disclosure of contingent assets and liabilities. We evaluate our estimates on an ongoing basis. We base our estimates on historical experience and on various other assumptions that are believed to be reasonable under the circumstances, the results of which form the basis for making judgments about the carrying values of assets and liabilities that are not readily apparent from other sources. Actual results may differ from these estimates under different assumptions or conditions.
Significant areas for which management uses estimates include:
| · | asset impairments, including broadcasting licenses, goodwill and other indefinite-lived intangible assets; |
| · | probabilities associated with the potential for contingent earn-out consideration; |
| · | fair value measurements; |
| · | contingency reserves; |
| · | allowance for doubtful accounts; |
| · | sales returns and allowances; |
| · | barter transactions; |
| · | inventory reserves; |
| · | reserves for royalty advances; |
| · | fair value of equity awards; |
| 69 |
| · | self-insurance reserves; |
| · | estimated lives for tangible and intangible assets; |
| · | income tax valuation allowances; and |
| · | uncertain tax positions. |
These estimates require the use of judgment as future events and the effect of these events cannot be predicted with certainty. The estimates will change as new events occur, as more experience is acquired and as more information is obtained. We evaluate and update our assumptions and estimates on an ongoing basis and we may consult outside experts to assist as considered necessary.
We believe the following accounting policies and the related judgments and estimates are critical accounting policies that affect the preparation of our Consolidated Financial Statements. For a more comprehensive list of our accounting policies, see Note 1 – Summary of Significant Accounting Policies, in the notes to our Consolidated Financial Statements contained in Item 8 of this annual report on Form 10-K. Note 1 contains several other policies which are important to the preparation of our Consolidated Financial Statements, but do not meet the SEC’s definition of critical accounting policies because they do not involve subjective or complex judgments.
Broadcast Licenses, Goodwill and Other Indefinite-Lived Intangible Assets
We have accounted for acquisitions for which a significant amount of the purchase price was allocated to broadcast licenses and goodwill. Approximately 71% of our total assets at December 31, 2017 consisted of indefinite-lived intangible assets including broadcast licenses, goodwill and mastheads. The value of these indefinite-lived intangible assets depends significantly upon the operating results of our businesses. We do not amortize goodwill or other indefinite-lived intangible assets, but rather test for impairment at least annually or more frequently if events or circumstances indicate that an asset may be impaired. We perform our annual impairment testing during the fourth quarter of each year, which coincides with our budget and planning process for the upcoming year.
We believe that our estimate of the value of our broadcast licenses, mastheads, and goodwill is a critical accounting estimate as the value is significant in relation to our total assets, and our estimates incorporate variables and assumptions that are based on experiences and judgment about future operating performance of our markets and business segments. We did not find reconciliation to our current market capitalization meaningful in the determination of our enterprise value given current factors that impact our market capitalization, including but not limited to: limited trading volume, the impact of our publishing segment operating losses and the significant voting control of our Chairman and Chief Executive Officer.
The fair value measurements for our indefinite-lived intangible assets use significant unobservable inputs that reflect our own assumptions about the estimates that market participants would use in measuring fair value including assumptions about risk. If actual future results are less favorable than the assumptions and estimates we used, we are subject to future impairment charges, the amount of which may be material. The fair value measurements for our indefinite-lived intangible assets use significant unobservable inputs that reflect our own assumptions about the estimates that market participants would use in measuring fair value including assumptions about risk. The unobservable inputs are defined in FASB ASC Topic 820, Fair Value Measurements and Disclosures as Level 3 inputs discussed in detail in Note 12 in the notes to our Consolidated Financial Statements contained in Item 8 of this annual report on form 10-K.
We are permitted to perform a qualitative assessment as to whether it is more likely than not that an indefinite-lived intangible asset is impaired. This qualitative assessment requires significant judgment in considering events and circumstances that may affect the estimated fair value of our indefinite-lived intangible assets and requires that we weigh these events and circumstances by what we believe to be the strongest to weakest indicator of potential impairment. If it is more likely than not that an impairment exists, we are required to perform a quantitative analysis to estimate the fair value of the assets.
ASU 2012-02 provides examples of events and circumstances that could affect the estimated fair value of indefinite-lived intangible assets; however, the examples are not all-inclusive and are not by themselves indicators of impairment. We consider these events and circumstances, as well as other external and internal considerations. Our analysis includes the following events and circumstances, which are presented in the order of what we believe to be the strongest to weakest indicators of impairment:
| (1) | the difference between any recent fair value calculations and the carrying value; |
| (2) | financial performance, such as station operating income, including performance as compared to projected results used in prior estimates of fair value; |
| (3) | macroeconomic economic conditions, including limitations on accessing capital that could affect the discount rates used in prior estimates of fair value; |
| (4) | industry and market considerations such as a declines in market-dependent multiples or metrics, a change in demand, competition, or other economic factors; |
| (5) | operating cost factors, such as increases in labor, that could have a negative effect on future expected earnings and cash flows; |
| 70 |
| (6) | legal, regulatory, contractual, political, business, or other factors; |
| (7) | other relevant entity-specific events such as changes in management or customers; and |
| (8) | any changes to the carrying amount of the indefinite-lived intangible asset. |
If the results of our qualitative assessment indicate that the fair value of a reporting unit is less than its carrying value, we engage an independent third-party appraisal and valuation firm to assist us with determining the enterprise value as part of our quantitative review.
When performing a quantitative review of broadcast licenses, we estimate the fair value of each market cluster using the Greenfield Method, a form of the income approach. The premise of the Greenfield Method is that the value of an FCC license is equivalent to a hypothetical start-up in which the only asset owned by the station as of the valuation date is the FCC license. This approach eliminates factors that are unique to the operation of the station, including its format and historical financial performance. The method then assumes the entity has to purchase, build, or rent all of the other assets needed to operate a comparable station to the one in which the FCC license is being utilized as of the valuation date. Cash flows are estimated and netted against all start-up costs, expenses and investments necessary to achieve a normalized and mature state of operations, thus reflecting only the cash flows directly attributable to the FCC License. A multi-year discounted cash flow approach is then used to determine the net present value of these cash flows to derive an indication of fair value. For cash flows beyond the projection period, a terminal value is calculated using the Gordon constant growth model and long-term industry growth rate assumptions based on long-term industry growth and Gross Domestic Product (“GDP”) inflation rates.
The primary assumptions used in the Greenfield Method are:
| (1) | gross operating revenue in the station’s designated market area; |
| (2) | normalized market share; |
| (3) | normalized profit margin; |
| (4) | duration of the “ramp-up” period to reach normalized operations, (which was assumed to be three years), |
| (5) | estimated start-up costs (based on market size); |
| (6) | ongoing replacement costs of fixed assets and working capital; |
| (7) | the calculations of yearly net free cash flows to invested capital; and |
| (8) | amortization of the intangible asset, or the broadcast license. |
When performing our annual impairment testing for goodwill, the fair value of each applicable accounting unit is estimated using a discounted cash flow analysis, which is a form of the income approach. The discounted cash flow analysis utilizes a five to seven year projection period to derive operating cash flow projections from a market participant view. We make certain assumptions regarding future revenue growth based on industry market data, historical performance and our expected future performance. We also make assumptions regarding working capital requirements and ongoing capital expenditures for fixed assets. Future net free cash flows are calculated on a debt free basis and discounted to present value using a risk adjusted discount rate. The terminal year value is calculated using the Gordon constant growth method and long-term growth rate assumptions based on long-term industry growth and GDP inflation rates. The resulting fair value estimates, net of any interest bearing debt, are compared to the carrying value of each reporting unit’s net assets.
In January 2017, the FASB issued ASU 2017-04, Intangibles – Goodwill and Other (Topic 350): Simplifying the Test for Goodwill Impairment, which eliminates the requirement to calculate the implied fair value of goodwill in Step 2 of the goodwill impairment test. Under ASU 2017-04, goodwill impairment charges will be based on the excess of a reporting unit’s carrying amount over its fair value as determined in Step 1 of the testing. ASU 2017-04 is effective for interim and annual testing dates after January 1, 2019, with early adoption permitted for interim and annual goodwill impairment testing dates after January 1, 2017. We elected to adopt the guidance as of our impairment testing in the fourth quarter of 2017. The guidance did not have an impact on our financial position, results of operations, cash flows, or presentation thereof.
When performing a quantitative analysis to estimate the fair value of mastheads, the Relief from Royalty method is used. The Relief from Royalty method estimates the fair value of mastheads through use of a discounted cash flow model that incorporates a hypothetical “royalty rate” that a third-party owner would be willing to pay in lieu of owning the asset. The royalty rate is based on observed royalty rates for comparable assets as of the measurement date. We adjust the selected royalty rate to account for a percentage of the royalty fee that could be attributed to the use of other intangibles, such as goodwill, time in existence, trade secrets and industry expertise. The adjusted royalty rate represents the royalty fee remaining that could be attributed to the use of the masthead only.
If the results of our analysis indicate that the fair value of a reporting unit is less than its carrying value, an impairment is recorded equal to the amount by which the carrying value exceeds the estimated fair value.
We believe we have made reasonable estimates and assumptions to calculate the estimated fair value of our indefinite-lived intangible assets, however, these estimates and assumptions are highly judgmental in nature. Actual results can be materially different from estimates and assumptions. If actual market conditions are less favorable than those projected by the industry or by us, or if events occur or circumstances change that would reduce the estimated fair value of our indefinite-lived intangible assets below the amounts reflected on our balance sheet, we may recognize future impairment charges, the amount of which may be material.
| 71 |
Sensitivity of Key Broadcasting Licenses, Goodwill and Other Indefinite-Lived Intangible Assets Assumptions
When estimating the fair value of our broadcasting licenses and goodwill, we make assumptions regarding revenue growth rates, operating cash flow margins and discount rates. These assumptions require substantial judgment, and actual rates and margins may differ materially. We prepared a sensitivity analysis of these assumptions and the hypothetical non-cash impairment charge that would have resulted if our estimated discount rate were increased.
We performed a sensitivity analysis of certain current year key assumptions, including the long-term revenue growth rate and the WACC to determine the impact that such changes would have on the estimated fair value of our broadcast licenses. The sensitivity analysis indicated that a reduction in the long-term revenue growth rate by 100 basis points and an increase in the WACC by 100 basis points would have resulted in an additional impairment to our broadcast licenses of $40.0 million.
We performed a sensitivity analysis of certain current year key assumptions, including the long-term revenue growth rate and the WACC, to determine the impact that such changes would have on the estimated fair value of goodwill associated with our broadcast segment. The sensitivity analysis indicated that reducing the long-term revenue growth rates by 100 basis points and increasing the WACC by 100 basis points would have resulted in an impairment to goodwill associated with our broadcast entities of $0.6 million.
We performed a sensitivity analysis of certain current year key assumptions, including the long-term revenue growth rate and the WACC, to determine the impact that such changes would have on the estimated fair value of goodwill associated with our digital media segment. The sensitivity analysis indicated that reducing the long-term revenue growth rates by 100 basis points and increasing the WACC by 100 basis points would have no incremental impact to the goodwill associated with our digital media entities.
We performed a sensitivity analysis of certain current year key assumptions, including the long-term revenue growth rate and the WACC, to determine the impact that such changes would have on the estimated fair value of goodwill associated with our publishing segment. The sensitivity analysis indicated that reducing the long-term revenue growth rate by 100 basis points and increasing the WACC by 100 basis points would have no incremental impact to the carrying value of goodwill associated with our publishing entities.
We performed a sensitivity analysis of certain current year key assumptions, including the long-term revenue growth rate and the WACC, to determine the impact that such changes would have on the estimated fair value of mastheads. The sensitivity analysis indicated that reducing the long-term revenue growth rate by 100 basis points and increasing the WACC by 100 basis points would have no incremental impact to the carrying value of mastheads.
Impairment of Long-Lived Assets
We account for property and equipment in accordance with FASB ASC Topic 360-10, Property, Plant and Equipment. We periodically review our long-lived assets for impairment whenever events or changes in circumstances indicate that the carrying amount of the assets may not be fully recoverable. In accordance with authoritative guidance for impairment of long-lived assets, we must estimate the fair value of assets when events or circumstances indicate that they may be impaired. The fair value measurements for our long-lived assets use significant observable inputs that reflect our own assumptions about the estimates that market participants would use in measuring fair value including assumptions about risk. If actual future results are less favorable than the assumptions and estimates we used, we are subject to future impairment charges, the amount of which may be material.
We believe we have made reasonable estimates and assumptions to calculate the estimated fair value of our long-lived assets, however, these estimates and assumptions are highly judgmental in nature. Actual results can be materially different from estimates and assumptions. If actual market conditions are less favorable than those projected by the industry or by us, or if events occur or circumstances change that would reduce the estimated fair value of long-lived assets below the amounts reflected on our balance sheet, we may recognize future impairment charges, the amount of which may be material.
Business Acquisitions
We account for business acquisitions in accordance with the acquisition method of accounting as specified in FASB ASC Topic 805 Business Combinations. The total acquisition consideration is allocated to assets acquired and liabilities assumed based on their estimated fair values as of the date of the transaction. Estimates of the fair value include discounted estimated cash flows to be generated by the assets and their expected useful lives based on historical experience, market trends and any synergies believed to be achieved from the acquisition. The excess of consideration paid over the estimated fair values of the net assets acquired is recorded as goodwill and any excess of fair value of the net assets acquired over the consideration paid is recorded as a gain on bargain purchase. Prior to recording a gain, the acquiring entity must reassess whether all acquired assets and assumed liabilities have been identified and recognized and perform re-measurements to verify that the consideration paid, assets acquired, and liabilities assumed have been properly valued.
| 72 |
Acquisitions may include contingent earn-out consideration, the fair value of which is estimated as of the acquisition date as the present value of the expected contingent payments as determined using weighted probabilities of the payment amounts.
A majority of our radio station acquisitions have consisted primarily of the FCC licenses to broadcast in a particular market. We often do not acquire the existing format, or we change the format upon acquisition when we find it beneficial. As a result, a substantial portion of the purchase price for the assets of a radio station is allocated to the broadcast license.
We may retain a third-party appraiser to estimate the fair value of the acquired net assets as of the acquisition date. As part of the valuation and appraisal process, the third-party appraiser prepares a report assigning estimated fair values to the various asset categories in our financial statements. These fair value estimates are subjective in nature and require careful consideration and judgment. Management reviews the third party reports for reasonableness of the assigned values. We believe that the purchase price allocations represent the appropriate estimated fair value of the assets acquired and we have not had to modify our purchase price allocations.
We estimate the economic life of each tangible and intangible asset acquired to determine the period of time in which the asset should be depreciated or amortized. A considerable amount of judgment is required in assessing the economic life of each asset. We consider our own experience with similar assets, industry trends, market conditions and the age of the property at the time of our acquisition to estimate the economic life of each asset. If the financial condition of the assets were to deteriorate, the resulting change in life or impairment of the asset could cause a material impact and volatility in our operating results. To date, we have not experienced changes in the economic life established for each major category of our assets.
Contingent Earn-Out Consideration
Our acquisitions often include contingent earn-out consideration as part of the purchase price. The fair value of the contingent earn-out consideration is estimated as of the acquisition date based on the present value of the contingent payments expected to be made using a weighted probability of possible payments. The unobservable inputs used in the determination of the fair value of the contingent earn-out consideration include our own assumptions about the likelihood of payment based on the established benchmarks and discount rates based on our internal rate of return analysis. The fair value measurement includes inputs that are Level 3 measurement as discussed in Note 12 in the notes to our Consolidated Financial Statements contained in Item 8 of this annual report on Form 10-K.
We review the probabilities of possible future payments to the estimated fair value of any contingent earn-out consideration on a quarterly basis over the earn-out period. Actual results are compared to the estimates and probabilities of achievement used in our forecasts. Should actual results increase or decrease as compared to the assumption used in our analysis, the fair value of the contingent earn-out consideration obligations will increase or decrease, up to the contracted limit, as applicable. Changes in the fair value of the contingent earn-out consideration could cause a material impact and volatility in our operating results. We recorded a net decrease to our estimated contingent earn-out liabilities of $23,000 for the year ended December 31, 2017 and $0.7 million for the year ended December 31, 2016. The changes in our estimates reflect volatility from variables, such as revenue growth, page views and session time as discussed in Note 5 – Contingent Earn-Out Consideration in the notes to our Consolidated Financial Statements contained in Item 8 of this annual report on Form 10-K.
We believe that we have used reasonable estimates and assumptions to calculate the estimated fair value of all remaining contingent earn-out consideration however, these estimates and assumptions are highly judgmental in nature. Actual results can be materially different from estimates and assumptions.
Fair Value Measurements
FASB ASC Topic 820, Fair Value Measurements and Disclosures established a single definition of fair value in generally accepted accounting principles and requires expanded disclosure requirements about fair value measurements. The provision applies to other accounting pronouncements that require or permit fair value measurements. This includes applying the fair value concept to (i) nonfinancial assets and liabilities initially measured at fair value in business combinations; (ii) reporting units or nonfinancial assets and liabilities measured at fair value in conjunction with goodwill impairment testing; (iii) other nonfinancial assets measured at fair value in conjunction with impairment assessments; and (iv) asset retirement obligations initially measured at fair value.
The fair value provisions include guidance on how to estimate the fair value of assets and liabilities in the current economic environment and reemphasize that the objective of a fair value measurement remains an exit price. If we were to conclude that there has been a significant decrease in the volume and level of activity of the asset or liability in relation to normal market activities, quoted market values may not be representative of fair value and we may conclude that a change in valuation technique or the use of multiple valuation techniques may be appropriate.
| 73 |
The degree of judgment utilized in measuring the fair value of financial instruments generally correlates to the level of pricing observability. Pricing observability is affected by a number of factors, including the type of financial instrument, whether the financial instrument is new to the market, and the characteristics specific to the transaction. Financial instruments with readily available active quoted prices or for which fair value can be measured from actively quoted prices generally will have a higher degree of pricing observability and a lesser degree of judgment utilized in measuring fair value. Conversely, financial instruments rarely traded or not quoted will generally have less (or no) pricing observability and a higher degree of judgment utilized in measuring fair value.
FASB ASC Topic 820 established a hierarchal disclosure framework associated with the level of pricing observability utilized in measuring fair value. This framework defined three levels of inputs to the fair value measurement process and requires that each fair value measurement be assigned to a level corresponding to the lowest level input that is significant to the fair value measurement in its entirety. The three broad levels of inputs defined by the FASB ASC Topic 820 hierarchy are as follows:
| • | Level 1 Inputs—quoted prices (unadjusted) in active markets for identical assets or liabilities that the reporting entity has the ability to access at the measurement date; |
| • | Level 2 Inputs—inputs other than quoted prices included within Level 1 that are observable for the asset or liability, either directly or indirectly. If the asset or liability has a specified (contractual) term, a Level 2 input must be observable for substantially the full term of the asset or liability; and |
| • | Level 3 Inputs—unobservable inputs for the asset or liability. These unobservable inputs reflect the entity’s own assumptions about the assumptions that market participants would use in pricing the asset or liability, and are developed based on the best information available in the circumstances (which might include the reporting entity’s own data). |
We believe that we have used reasonable estimates and assumptions to calculate the estimated fair value of our financial assets as discussed in Note 12 in the notes to our Consolidated Financial Statements contained in Item 8 of this annual report on form 10-K.
Contingency Reserves
In the ordinary course of business, we are involved in various legal proceedings, lawsuits, arbitration and other claims that are complex in nature and have outcomes that are difficult to predict. Consequently, we are unable to ascertain the ultimate aggregate amount of monetary liability or the financial impact with respect to these matters. Certain of these proceedings are discussed in Note 14, Commitments and Contingencies, contained in our Consolidated Financial Statements.
We record contingency reserves to the extent we conclude that it is probable that a liability has been incurred and the amount of the related loss can be reasonably estimated. The establishment of the reserve is based on a review of all relevant factors, the advice of legal counsel, and the subjective judgment of management. The reserves we have recorded to date have not been material to our consolidated financial position, results of operations or cash flows. We believe that our estimates and assumptions are reasonable and that our reserves are accurately reflected.
While we believe that the final resolution of any known maters, individually and in the aggregate, will not have a material adverse effect upon our consolidated financial position, results of operations or cash flows, it is possible that we could incur additional losses. We maintain insurance that may provide coverage for such matters. Future claims against us, whether meritorious or not, could have a material adverse effect upon our consolidated financial position, results of operations or cash flows, including losses due to costly litigation and losses due to matters that require significant amounts of management time that can result in the diversion of significant operational resources.
Allowance for Doubtful Accounts
We evaluate the balance reserved in our allowance for doubtful accounts on a quarterly basis based on our historical collection experience, the age of the receivables, specific customer information and current economic conditions. Past due balances are generally not written-off until all of our collection efforts have been unsuccessful, including use of a collections agency. A considerable amount of judgment is required in assessing the likelihood of ultimate realization of these receivables, including the current creditworthiness of each customer. If the financial condition of our customers were to deteriorate, resulting in an impairment of their ability to make payments, additional allowances may be required. We have not modified our estimate methodology and we have not historically recognized significant losses from changes in our estimates. We believe that our estimates and assumptions are reasonable and that our reserves are accurately reflected.
Sales Returns and Allowances
We provide for estimated returns for products sold with the right of return, primarily book sales associated with Regnery Publishing and nutritional products sold our Wellness division. We record an estimate of these product returns as a reduction of revenue in the period of the sale. Our estimates are based upon historical sales returns, the amount of current period sales, economic trends and any changes in customer demand and acceptance of our products. We regularly monitor actual performance to estimated return rates and make adjustments as necessary. Estimated return rates utilized for establishing estimated returns reserves have approximated actual returns experience. However, actual returns may differ significantly, either favorably or unfavorably, from these estimates if factors such as the historical data we used to calculate these estimates do not properly reflect future returns or as a result of changes in economic conditions of the customer and/or the market. We have not modified our estimate methodology and we have not historically recognized significant losses from changes in our estimates. We believe that our estimates and assumptions are reasonable and that our reserves are accurately reflected.
| 74 |
Barter Transactions
We may provide broadcast time or digital advertising placement to customers in exchange for certain products, supplies or services. The terms of these exchanges generally permit for the preemption of such broadcast time or digital placements in favor of customers who purchase these items for cash. We include the value of such exchanges in net revenues and operating expenses. The value recorded for barter revenue and barter expense is based upon management’s estimate of the fair value of the products, supplies or services received. We believe that our estimates and assumptions are reasonable and that our barter revenue and barter expense are accurately reflected.
We record barter revenue as it is earned, typically when the broadcast time is used or the digital advertisement is delivered. We record barter expense equal to the estimated fair value of the goods or services received upon receipt or usage of the items as applicable. Barter advertising revenue included in broadcast revenue for the year ended December 31, 2017 and 2016, was approximately $5.8 million and $5.4 million, respectively. Barter expenses included in broadcast operating expense for the year ended December 31, 2017 and 2016 was approximately $5.6 million and $5.3 million, respectively. Barter advertising revenue included in digital media revenue for the year ended December 31, 2017 and 2016 was approximately $0.1 million and $42,000, respectively. Barter expenses included in digital media operating expense for the year ended December 31, 2017 and 2016 was approximately $0.1 million and $34,000, respectively.
Inventory Reserves
Inventories consist of finished goods, including published books and wellness products. Inventory is recorded at the lower of cost or market as determined on a First-In First-Out (“FIFO”) cost method. We reviewed historical data associated with book and wellness product inventories held by Regnery Publishing and our e-commerce wellness entities, as well as our own experiences to estimate the fair value of inventory on hand. Our analysis includes a review of actual sales returns, our allowances, royalty reserves, overall economic conditions and product demand. We record a provision to expense the balance of unsold inventory that we believe to be unrecoverable. We regularly monitor actual performance to our estimates and make adjustments as necessary. Estimated inventory reserves may be adjusted, either favorably or unfavorably, if factors such as the historical data we used to calculate these estimates do not properly reflect future returns or as a result of changes in economic conditions of the customer and/or the market. We have not modified our estimate methodology and we have not historically recognized significant losses from changes in our estimates. We believe that our estimates and assumptions are reasonable and that our reserves are accurately reflected.
Reserves for Royalty Advances
Royalties due to book authors are paid in advance and capitalized. Royalties are expensed as the related book revenues are earned or when we determine that future recovery of the royalty is not likely. We reviewed historical data associated with royalty advances, earnings and recoverability based on actual results of Regnery Publishing. Historically, the longer the unearned portion of an advance remains outstanding, the less likely it is that we will recover the advance through the sale of the book. We apply this historical experience to outstanding royalty advances to estimate the likelihood of recovery. A provision was established to expense the balance of any unearned advance which we believe is not recoverable. Our analysis also considers other discrete factors, such as death of an author, any decision to not pursue publication of a title, poor market demand or other relevant factors. We have not modified our estimate methodology and we have not historically recognized significant losses from changes in our estimates. We believe that our estimates and assumptions are reasonable and that our reserves are accurately reflected.
Fair Value of Equity Awards
We account for stock-based compensation under the provisions of FASB ASC Topic 718, Compensation—Stock Compensation. We record equity awards with stock-based compensation measured at the fair value of the award as of the grant date. We determine the fair value of each award using the Black-Scholes valuation model that requires the input of highly subjective assumptions, including the expected stock price volatility and expected term of the award granted. The exercise price for each award is equal to or greater than the closing market price of Salem Media Group, Inc. common stock as of the date of the award. We use the straight-line attribution method to recognize share-based compensation costs over the expected service period of the award. Upon exercise, cancellation, forfeiture, or expiration of the award, deferred tax assets for awards with multiple vesting dates are eliminated for each vesting period on a first-in, first-out basis as if each vesting period was a separate award. We have not modified our estimates or assumptions used in our valuation model. We believe that our estimates and assumptions are reasonable and that our stock based compensation is accurately reflected in our results of operations.
| 75 |
Partial Self-Insurance on Employee Health Plan
We provide health insurance benefits to eligible employees under a self-insured plan whereby we pay actual medical claims subject to certain stop loss limits. We record self-insurance liabilities based on actual claims filed and an estimate of those claims incurred but not reported. Our estimates are based on historical data and probabilities. Any projection of losses concerning our liability is subject to a high degree of variability. Among the causes of this variability are unpredictable external factors such as future inflation rates, changes in severity, benefit level changes, medical costs and claim settlement patterns. Should the actual amount of claims increase or decrease beyond what was anticipated, we may adjust our future reserves. Our self-insurance liability was $0.7 million and $0.8 million at December 31, 2017 and 2016, respectively. We have not modified our estimate methodology and we have not historically recognized significant losses from changes in our estimates. While we had an unusually high level of claims in the third quarter of 2016 due to a larger than normal number of expensive claims, we believe that our estimates and assumptions are reasonable and that our reserves are accurately reflected.
Income Tax Valuation Allowances (Deferred Taxes)
In preparing our consolidated financial statements, we estimate our income tax liability in each of the jurisdictions in which we operate by estimating our actual current tax exposure and assessing temporary differences resulting from differing treatment of items for tax and financial statement purposes. Our judgments, assumptions and estimates relative to the current provision for income tax take into account current tax laws, our interpretation of current tax laws and possible outcomes of audits conducted by tax authorities. Reserves for income taxes to address potential exposures involving tax positions that could be challenged by tax authorities are established if necessary. Although we believe our judgments, assumptions and estimates are reasonable, changes in tax laws or our interpretation of tax laws and the resolution of any future tax audits could significantly impact the amounts provided for income taxes in our consolidated financial statements.
We calculate our current and deferred tax provisions based on estimates and assumptions that could differ from the actual results reflected in income tax returns filed during the subsequent year. Adjustments based on filed returns are generally recorded in the period when the tax returns are filed and the tax implications are known. Tax law and rate changes are reflected in the income tax provision in the period in which such changes are enacted.
We record a valuation allowance to reduce our deferred tax assets to the amount that is more likely than not to be realized. We consider all available evidence, both positive and negative, including historical levels of income, expectations and risks associated with estimates of future taxable income and ongoing prudent and feasible tax planning strategies in assessing the need for a valuation allowance. In the event we were to determine that we would not be able to realize all or part of our net deferred tax assets in the future, an adjustment to the deferred tax assets would be charged to earnings in the period in which we make such a determination. Likewise, if we later determine that it is more likely than not that the net deferred tax assets would be realized, we would reverse the applicable portion of the previously provided valuation allowance.
For financial reporting purposes, we recorded a valuation allowance of $6.2 million as of December 31, 2017 to offset $6.0 million of the deferred tax assets related to the state net operating loss carryforwards and $0.2 million associated with asset impairments. For financial reporting purposes, we recorded a valuation allowance of $4.5 million as of December 31, 2016 to offset $4.2 million of the deferred tax assets related to the state net operating loss carryforwards and $0.3 million associated with asset impairments. During the third quarter of 2016, we identified an error in our estimated valuation allowance for certain deferred tax assets. We believe that our estimates and assumptions are reasonable and that our reserves are accurately reflected.
On December 22, 2017, the Act was signed into law making significant changes to the Internal Revenue Code. Changes include, but are not limited to, a U.S. corporate tax rate decrease from 35% to 21% effective for tax years beginning after December 31, 2017. We have calculated our best estimate of the impact of the Act in our year end income tax provision in accordance with our understanding of the Act and guidance available as of the date of this filing.
The SEC issued Staff Accounting Bulletin No. 118 (“SAB 118”) to address the application of US GAAP in situations when a registrant does not have the necessary information available, prepared, or analyzed (including computations) in reasonable detail to complete the accounting for certain income tax effects of the Act. SAB 118 summarizes a three-step process to be applied at each reporting period to account for and qualitatively disclose: (1) the effects of the change in tax law for which accounting is complete; (2) provisional amounts (or adjustments to provisional amounts) for the effects of the tax law where accounting is not complete, but that a reasonable estimate has been determined; and (3) a reasonable estimate cannot yet be made and therefore taxes are reflected in accordance with law prior to the enactment of the Tax Cuts and Jobs Act.
| 76 |
Amounts recorded where we consider accounting to be complete for the year ended December 31, 2017 principally relate to the reduction in the U.S. corporate income tax rate to 21%, which resulted in the recording of an income tax benefit of $23.0 million to remeasure deferred taxes liabilities associated primarily with intangible assets that are deemed to reverse at the new 21% tax rate.
Other significant provisions that are not yet effective but may impact income taxes in future years include limitations on the current deductibility of net interest expense, limitation of net operating losses generated after fiscal 2018 to 80% of taxable income, acceleration of tax revenue recognition and additional limitation on executive compensation.
Income Taxes and Uncertain Tax Positions
We are subject to audit and review by various taxing jurisdictions. We may recognize liabilities on our financial statements for positions taken on uncertain tax positions. When tax returns are filed, it is highly certain that some positions taken would be sustained upon examination by the taxing authorities, while others may be subject to uncertainty about the merits of the position taken or the amount of the position that would be ultimately sustained. The benefit of a tax position is recognized in the financial statements in the period during which, based on all available evidence, we believe it is more likely than not that the position will be sustained upon examination, including the resolution of appeals or litigation processes, if any. Such positions are deemed to be unrecognized tax benefits and a corresponding liability is established on the balance sheet. It is inherently difficult and subjective to estimate such amounts, as this requires us to make estimates based on the various possible outcomes.
We review and reevaluate uncertain tax positions on a quarterly basis. Changes in assumptions may result in the recognition of a tax benefit or an additional charge to the tax provision. During the year ended December 31, 2017, we did not have any material unrecognized tax benefits recorded. During the year ended December 31, 2016, we recognized a net decrease of $0.1 million in liabilities associated with uncertain tax positions. Accordingly, we have no liabilities for uncertain tax positions recorded at December 31, 2016. The $0.1 million balance at December 31, 2015 included approximately $21,000 of accrued interest, net of federal income tax benefits, and $6,000 for the related penalties previously recorded in income tax expense. Our evaluation was performed for all tax years that remain subject to examination, which range from 2013 through 2016. There are currently no tax examinations in process. In August 2017, we received a letter notifying us that the City of New York is initiating an audit of our tax returns for years 2013 and 2014. As of fourth quarter, we are still in the early stages of the audit. We do not anticipate the outcome to be material nor significant.
Recent Accounting Pronouncements
Recent accounting pronouncements are described in Note 1 to the accompanying financial statements.
LIQUIDITY AND CAPITAL RESOURCES
Our principal sources of funds have been operating cash flow, borrowings under credit facilities and proceeds from the sale of selected assets or businesses. We have historically funded, and will continue to fund, expenditures for operations, administrative expenses, and capital expenditures from these sources. We have historically financed acquisitions through borrowings, including borrowings under credit facilities and, to a lesser extent, from operating cash flow and from proceeds on selected asset dispositions. We expect to fund future acquisitions from cash on hand, borrowings under our credit facilities, operating cash flow and possibly through the sale of income-producing assets or proceeds from debt and equity offerings. We have assessed the current and expected economic outlook and our current and expected needs for funds and we believe that the borrowing capacity under our current credit facilities allows us to meet our ongoing operating requirements, fund capital expenditures and satisfy our debt service requirements for at least the next twelve months.
Our cash and cash equivalents balance decreased to $3,000 at December 31, 2017 as compared to $130,000 at December 31, 2016. We intentionally keep our cash and cash equivalents low, utilizing the swingline within the ABL Facility, to maximize debt repayments and to reduce interest expense. Our working capital decreased $10.8 million to $4.6 million as of December 31, 2017 compared to $15.4 million as of December 31, 2016 due to a $9.4 million reclass of current deferred income tax assets upon adoption of ASU 2015-17 and a $8.5 million increase in Revolver debt on the ABL offset by a $7.3 million decrease in accounts payable and accrued expenses.
Operating Cash Flows
Our largest source of operating cash inflows are receipts from customers in exchange for advertising and programming. Other sources of operating cash inflows include receipts from customers for digital downloads and streaming, book sales, subscriptions, self-publishing fees, ticket sales, sponsorships, and vendor promotions. A majority of our operating cash outflows consist of payments to employees, such as salaries and benefits, and vendor payments under facility and tower leases, talent agreements, inventory purchases and recurring services such as utilities and music license fees. Our operating cash flows are subject to factors such as fluctuations in preferred advertising media and changes in demand caused by shifts in population, station listenership, demographics, and audience tastes. In addition, our operating cash flows may be affected if our customers are unable to pay, delay payment of amounts owed to us, or if we experience reductions in revenue, or increases in costs and expenses.
| 77 |
Net cash provided by operating activities during the year ended December 31, 2016 decreased by $11.5 million to $27.4 million compared to $38.9 million during the prior year. The decrease in cash provided by operating activities includes the impact of the following items:
| · | Net income increased $15.2 million to $24.1 million compared to $8.9 million for the prior year; |
| · | Net accounts receivables decreased $2.4 million; |
| · | Our Day’s Sales Outstanding, or the average number of days to collect cash from the date of sale, increased to 65 days at December 31, 2017 compared to 64 days for the prior year; |
| · | Net accounts payable and accrued expenses decreased $7.3 million to $13.3 million from $20.6 million as of the prior year; and |
| · | Net inventories on hand increased $0.1 million to $730,000 at December 31, 2017 compared to a decrease of $0.2 million to $670,000 as of the prior year. |
Investing Cash Flows
Our primary source of investing cash inflows includes proceeds from the sale or disposal of assets or businesses. Our investing cash outflows include cash payments made to acquire businesses, to acquire property and equipment and to acquire intangible assets such as domain names. While our focus continues to be on deleveraging the company, we remain committed to explore and pursue strategic acquisitions.
In recent years, our acquisition agreements have contained contingent earn-out arrangements that are payable in the future based on the achievement of predefined operating results. We believe that these contingent earn-out arrangements provide some degree of protection with regard to our cash outflows should these acquisitions not meet our operational expectations.
We plan to fund future purchases and any acquisitions from cash on hand, operating cash flow or our credit facilities. These transactions include our option to acquire radio station KHTE-FM, Little Rock, Arkansas, for $1.2 million in cash during the TBA period under which we are programming the station. The 36-month TBA began on April 1, 2015 with an option to extend to 48 months. We are required to pay the licenses a $0.1 million fee if we do not exercise our option right to purchase the station.
We undertake projects from time to time to upgrade our radio station technical facilities and/or FCC broadcast licenses, expand our digital and web-based offerings, improve our facilities and upgrade our computer infrastructures. The nature and timing of these upgrades and expenditures can be delayed or scaled back at the discretion of management. Based on our current plans, we expect to incur capital expenditures of approximately $8.8 million during 2018.
Net cash used in investing activities during the year ended December 31, 2017 decreased $5.2 million to $10.3 million compared to $15.5 million during the prior year. The decrease in cash used for investing activities includes:
| · | Cash paid for acquisitions decreased $4.4 million to $4.0 million compared to $8.4 million during the prior year; |
| · | Cash paid for capital expenditures decreased $0.9 million to $8.5 million compared to $9.4 million during the prior year; |
| · | Cash paid for capital expenditures reimbursable under tenant improvement allowances decreased $0.5 million to $0.1 million compared to $0.6 million during the prior year; and |
| · | Proceeds from the sale of assets decreased $0.7 million to $2.4 million compared to $3.1 million during the prior year. |
Financing Cash Flows
Financing cash inflows include borrowings under our credit facilities and any proceeds from the exercise of stock options issued under our stock incentive plan. Financing cash outflows include repayments of our credit facilities, the payment of equity distributions and payments of amounts due under deferred installments and contingency earn-out consideration associated with acquisition activity.
We believe that cash payments for deferred installments and contingent earn-out consideration that were entered contemporaneously with an acquisition are appropriately recorded as financing activities. These payments are similar to seller financing arrangements in that cash payments are typically due one to three years after the acquisition date. We referred to guidance in FASB ASC Topic 230-10-45-13 (c) which states that only advance payments, down payments, or other amounts paid at the time of purchase or soon before or after a purchase of property, plant and equipment and other productive assets are investing cash outflows. The guidance clarifies that incurring directly related debt to the seller is a financing transaction and that subsequent payments of that debt are financing cash outflows. This is consistent with the guidance in FASB ASU 2016-15, Statement of Cash Flows (Topic 230): Classification of Certain Cash Receipts and Cash Payments, which clarifies how entities should classify certain cash receipts and cash payments on the statement of cash flows issued in August 2016. During the year ended December 31, 2017, we paid $14,000 in cash for contingent earn-out consideration due under acquisition agreements and $0.2 million in cash for the deferred installments.
| 78 |
Throughout the period ended May 19, 2017, the principal balances outstanding under our previous credit facilities ranged from $258.0 million to $263.5 million. From May 19, 2017 through December 31, 2017, the principal balances outstanding under the Notes and ABL Facility ranged from $258.0 million to $268.8 million. These outstanding balances were ordinary and customary based on our operating and investing cash needs during this time.
Any future equity distributions are likely to be comparable to prior declarations unless there are changes in expected future earnings, cash flows, financial and legal requirements. Based on the number of shares of Class A and Class B common stock currently outstanding we expect to pay total annual equity distributions of approximately $6.8 million in 2018. However, the actual declaration of dividends and equity distributions, as well as the establishment of per share amounts, dates of record, and payment dates are subject to final determination by our Board of Directors and depend upon future earnings, cash flows, financial and legal requirements, and other factors.
Our sole source of cash available for making any future equity distributions is our operating cash flow, subject to our credit facilities and Notes, which contain covenants that restrict the payment of dividends and equity distributions unless certain specified conditions are satisfied.
Net cash used in financing activities during the year ended December 31, 2017 decreased $6.2 million to $17.1 million compared to $23.3 million during the prior year. The decrease in cash used for financing activities includes:
| · | We paid the remaining principal balance outstanding on the Term Loan B of $258.0 million and terminated the Term Loan B; |
| · | We paid the remaining principal outstanding on the Revolver and terminated the related credit agreement; |
| · | We issued the 6.75% Senior Secured Notes and received gross proceeds of $255.0 million upon issuance; |
| · | We entered into the ABL Facility for $30.0 million and borrowed $69.4 million at various times of proceeds thereunder; |
| · | We subsequently repaid $60.4 million at various times on the ABL Facility; |
| · | We paid $0.2 million of cash against deferred installments due under our purchase agreements during the year ended December 31, 2017 compared to $3.6 million for the prior year; |
| · | We paid $14,000 of cash for the amount earned under the contingent earn-out provision of our purchase agreements during the year ended December 31, 2017 compared to $0.1 million during the prior year; |
| · | The book overdraft was a $3.2 million use of cash at December 31, 2017 compared to a $12,000 source of cash for the prior year; and |
| · | We paid cash equity distributions of $6.8 million on our Class A and Class B common stock compared to $6.7 million during the prior year. |
Salem Media Group, Inc. has no independent assets or operations, the subsidiary guarantees are full and unconditional and joint and several, and any subsidiaries of Salem Media Group, Inc. other than the subsidiary guarantors are minor.
6.75% Senior Secured Notes
On May 19, 2017, we issued in a private placement the Notes, which were guaranteed on a senior secured basis by our existing subsidiaries (the “Subsidiary Guarantors”). The Notes bear interest at a rate of 6.75% per year and mature on June 1, 2024, unless earlier redeemed or repurchased. Interest initially accrues on the Notes from May 19, 2017 and is payable semi-annually, in cash in arrears, on June 1 and December 1 of each year, commencing December 1, 2017.
The Notes and the ABL Facility are secured by liens on substantially all of our and the Subsidiary Guarantors’ assets, other than certain excluded assets. The ABL Facility has a first-priority lien on our and the Subsidiary Guarantor’s accounts receivable, inventory, deposit and securities accounts, certain real estate and related assets (the “ABL Priority Collateral”). The Notes are secured by a first-priority lien on substantially all other assets of ours and the Subsidiary Guarantors (the “Notes Priority Collateral”). There is no direct lien on our Federal Communications Commission (“FCC”) licenses to the extent prohibited by law or regulation.
We may redeem the Notes, in whole or in part, at any time on or after June 1, 2020 at a price equal to 100% of the principal amount of the Notes plus a “make-whole” premium as of, and accrued and unpaid interest, if any, to, but not including, the redemption date. At any time on or after June 1, 2020, we may redeem some or all of the Notes at the redemption prices (expressed as percentages of the principal amount to be redeemed) set forth in the Notes, plus accrued and unpaid interest, if any, to, but not including, the redemption date. In addition, we may redeem up to 35% of the aggregate principal amount of the Notes before June 1, 2020 with the net cash proceeds from certain equity offerings at a redemption price of 106.75% of the principal amount plus accrued and unpaid interest, if any, to, but not including, the redemption date. We may also redeem up to 10% of the aggregate original principal amount of the Notes per twelve month period before June 1, 2020 at a redemption price of 103% of the principal amount plus accrued and unpaid interest to, but not including, the redemption date.
| 79 |
The indenture relating to the Notes (the “Indenture”) contains covenants that, among other things and subject in each case to certain specified exceptions, limit our ability and the ability of our restricted subsidiaries to: (i) incur additional debt; (ii) declare or pay dividends, redeem stock or make other distributions to stockholders; (iii) make investments; (iv) create liens or use assets as security in other transactions; (v) merge or consolidate, or sell, transfer, lease or dispose of substantially all of our assets; (vi) engage in transactions with affiliates; and (vii) sell or transfer assets.
The Indenture provides for the following events of default (each, an “Event of Default”): (i) default in payment of principal or premium on the Notes at maturity, upon repurchase, acceleration, optional redemption or otherwise; (ii) default for 30 days in payment of interest on the Notes; (iii) the failure by us or certain restricted subsidiaries to comply with other agreements in the Indenture or the Notes, in certain cases subject to notice and lapse of time; (iv) the failure of any guarantee by certain significant Subsidiary Guarantors to be in full force and effect and enforceable in accordance with its terms, subject to notice and lapse of time; (v) certain accelerations (including failure to pay within any grace period) of other indebtedness of ours or any restricted subsidiary if the amount accelerated (or so unpaid) is at least $15 million; (vi) certain judgments for the payment of money in excess of $15 million; (vii) certain events of bankruptcy or insolvency with respect to us or any significant subsidiary; and (vii) certain defaults with respect to any collateral having a fair market value in excess of $15 million. If an Event of Default occurs and is continuing, the Trustee or the holders of at least 25% in principal amount of the outstanding Notes may declare the principal of the Notes and any accrued interest on the Notes to be due and payable immediately, subject to remedy or cure in certain cases. Certain events of bankruptcy or insolvency are Events of Default which will result in the Notes being due and payable immediately upon the occurrence of such Events of Default.
We are required to pay $17.2 million per year in interest on the Notes. As of December 31, 2017, accrued interest on the Notes was $1.4 million.
We incurred debt issuance costs of $6.3 million that were recorded as a reduction of the debt proceeds that are being amortized to non-cash interest expense over the life of the Notes using the effective interest method. During the year ended December 31, 2017, $0.6 million of debt issuance costs associated with the Notes were amortized to interest expense.
Asset-Based Revolving Credit Facility
On May 19, 2017, the Company also entered into the ABL Facility pursuant to a Credit Agreement (the “Credit Agreement”) by and among us, as a borrower, our subsidiaries party thereto, as borrowers, Wells Fargo Bank, National Association, as administrative agent and lead arranger, and the lenders that are parties thereto. We used the proceeds of the ABL Facility, together with the net proceeds from the Notes offering, to repay outstanding borrowings under our previously existing senior credit facilities, and related fees and expenses. Going forward, the proceeds of the ABL Facility will be used to provide ongoing working capital and for other general corporate purposes (including permitted acquisitions).
The ABL Facility is a five-year $30.0 million revolving credit facility due May 19, 2022, which includes a $5.0 million subfacility for standby letters of credit and a $7.5 million subfacility for swingline loans. All borrowings under the ABL Facility accrue at a rate equal to a base rate or LIBOR rate plus a spread. The spread, which is based on an availability-based measure, ranges from 0.50% to 1.00% for base rate borrowings and 1.50% to 2.00% for LIBOR rate borrowings. If an event of default occurs, the interest rate may increase by 2.00% per annum. Amounts outstanding under the ABL Facility may be paid and then reborrowed at our discretion without penalty or premium. Additionally, we pay a commitment fee on the unused balance of 0.25% to 0.375% per year.
The ABL Facility is secured by a first-priority lien on the ABL Priority Collateral and by a second-priority lien on the Notes Priority Collateral. There is no direct lien on the Company’s FCC licenses to the extent prohibited by law or regulation (other than the economic value and proceeds thereof).
The Credit Agreement includes a springing fixed charge coverage ratio of 1.0 to 1.0, which is tested during the period commencing on the last day of the fiscal month most recently ended prior to the date on which Availability (as defined in the Credit Agreement) is less than the greater of 15% of the Maximum Revolver Amount (as defined in the Credit Agreement) and $4.5 million and continuing for a period of 60 consecutive days after the first day on which Availability exceeds such threshold amount. The Credit Agreement also includes other negative covenants that are customary for credit facilities of this type, including covenants that, subject to exceptions described in the Credit Agreement, restrict the ability of the borrowers and their subsidiaries (i) to incur additional indebtedness; (ii) to make investments; (iii) to make distributions, loans or transfers of assets; (iv) to enter into, create, incur, assume or suffer to exist any liens, (v) to sell assets; (vi) to enter into transactions with affiliates; (vii) to merge or consolidate with, or dispose of all assets to a third party, except as permitted thereby; (viii) to prepay indebtedness; and (ix) to pay dividends.
The Credit Agreement provides for the following events of default: (i) default for non-payment of any principal or letter of credit reimbursement when due or any interest, fees or other amounts within five days of the due date; (ii) the failure by any borrower or any subsidiary to comply with any covenant or agreement contained in the Credit Agreement or any other loan document, in certain cases subject to applicable notice and lapse of time; (iii) any representation or warranty made pursuant to the Credit Agreement or any other loan document is incorrect in any material respect when made; (iv) certain defaults of other indebtedness of any borrower or any subsidiary of indebtedness of at least $10 million; (v) certain events of bankruptcy or insolvency with respect to any borrower or any subsidiary; (vi) certain judgments for the payment of money of $10 million or more; (vii) a change of control; and (viii) certain defaults relating to the loss of FCC licenses, cessation of broadcasting and termination of material station contracts. If an event of default occurs and is continuing, the Administrative Agent and the Lenders may accelerate the amounts outstanding under the ABL Facility and may exercise remedies in respect of the collateral.
| 80 |
We incurred debt issue costs of $0.7 million that were recorded as an asset and are being amortized to non-cash interest expense over the term of the ABL Facility using the effective interest method. During the year ended December 31, 2017, $0.2 million of debt issue costs associated with the Notes were amortized to interest expense. At December 31, 2017, the blended interest rate on amounts outstanding under the ABL Facility was 3.64%.
We report outstanding balances on the ABL Facility as short-term regardless of the maturity date based on use of the ABL Facility to fund ordinary and customary operating cash needs with frequent repayments. We believe that our borrowing capacity under the ABL Facility allows us to meet our ongoing operating requirements, fund capital expenditures and satisfy our debt service requirements for at least the next twelve months.
Prior Term Loan B and Revolving Credit Facility
Our prior credit facility consisted of a term loan of $300.0 million (“Term Loan B”) and a revolving credit facility of $25.0 million (“Revolver”). The Term Loan B was issued at a discount for total net proceeds of $298.5 million. The discount was amortized to non-cash interest expense over the life of the loan using the effective interest method. For the year ended December 31, 2017, 2016 and 2015, approximately $74,000, $206,000 and $188,000, respectively, of the discount associated with the Term Loan B was amortized to interest expense.
The Term Loan B had a term of seven years, maturing in March 2020. On May 19, 2017, we used the net proceeds of the Notes and a portion of the ABL Facility to fully repay amounts outstanding under the Term Loan B of $258.0 million and under the Revolver of $4.1 million. We recorded a pre-tax loss on the early retirement of long-term debt of $2.1 million, which included $1.5 million of unamortized debt issuance costs on the Term Loan B and the Revolver and $0.6 million of unamortized discount on the Term Loan B.
The following payments or prepayments of the Term Loan B were made during the year ended December 31, 2016 and through the date of the termination, including interest through the payment date as follows:
| Date | Principal Paid | Unamortized Discount | ||||||
| (Dollars in Thousands) | ||||||||
| May 19, 2017 | $ | 258,000 | $ | 550 | ||||
| February 28, 2017 | 3,000 | 6 | ||||||
| January 30, 2017 | 2,000 | 5 | ||||||
| December 30, 2016 | 5,000 | 12 | ||||||
| November 30, 2016 | 1,000 | 3 | ||||||
| September 30, 2016 | 1,500 | 4 | ||||||
| September 30, 2016 | 750 | — | ||||||
| June 30, 2016 | 441 | 1 | ||||||
| June 30, 2016 | 750 | — | ||||||
| March 31, 2016 | 750 | — | ||||||
| March 17, 2016 | 809 | 2 | ||||||
Debt issuance costs were amortized to non-cash interest expense over the life of the Term Loan B using the effective interest method. For the year ended December 31, 2017, 2016 and 2015, approximately $203,000, $562,000 and $558,000, respectively, of the debt issuance costs associated with the Term Loan B were amortized to interest expense.
Debt issuance costs associated with the Revolver were recorded as an asset in accordance with ASU 2015-15. The costs were amortized to non-cash interest expense over the five-year life of the Revolver using the effective interest method based on an imputed interest rate of 4.58%. For the year ended December 31, 2017, 2016 and 2015, we recorded amortization of deferred financing costs of approximately $26,000, $70,000 and $68,000, respectively.
| 81 |
Summary of long-term debt obligations
Long-term debt consisted of the following:
| As of December 31, | ||||||||
| 2016 | 2017 | |||||||
| (Dollars in thousands) | ||||||||
| 6.75% Senior Secured Notes | $ | — | $ | 255,000 | ||||
| Less unamortized debt issuance costs based on imputed interest rate of 7.08% | — | (5,774 | ) | |||||
| 6.75% Senior Secured Notes net carrying value | — | 249,226 | ||||||
| Asset-Based Revolving Credit Facility principal outstanding | — | 9,000 | ||||||
| Term Loan B principal amount | 263,000 | — | ||||||
| Less unamortized discount and debt issuance costs based on imputed interest rate of 4.78% | (2,371 | ) | — | |||||
| Term Loan B net carrying value | 260,629 | — | ||||||
| Revolver principal outstanding | 477 | — | ||||||
| Capital leases and other loans | 568 | 462 | ||||||
| Long-term debt and capital lease obligations less unamortized debt issuance costs | 261,674 | 258,688 | ||||||
| Less current portion | (590 | ) | (9,109 | ) | ||||
| Long-term debt and capital lease obligations less unamortized debt issuance costs, net of current portion | $ | 261,084 | $ | 249,579 | ||||
In addition to the outstanding amounts listed above, we also have interest payments related to our long-term debt as follows as of December 31, 2017:
| · | Outstanding borrowings of $9.0 million under the ABL Facility, with interest payments ranges from 0.50% to 1.00% for base rate borrowings and 1.50% to 2.00% for LIBOR rate borrowings; |
| · | $255.0 million aggregate principal amount of Notes with semi-annual interest payments at an annual rate of 6.75%; and |
| · | Commitment fee of 0.25% to 0.375% per annum on the unused portion of the ABL Facility. |
Other Debt
We have several capital leases related to office equipment. The obligation recorded at December 31, 2017 and December 31, 2016 represents the present value of future commitments under the capital lease agreements.
Maturities of Long-Term Debt and Capital Lease Obligations
Principal repayment requirements under all long-term debt agreements outstanding at December 31, 2017 for each of the next five years and thereafter are as follows:
| Amount | ||||
| For the Year Ended December 31, | (Dollars in thousands) | |||
| 2018 | $ | 9,109 | ||
| 2019 | 107 | |||
| 2020 | 110 | |||
| 2021 | 125 | |||
| 2022 | 11 | |||
| Thereafter | 255,000 | |||
| $ | 264,462 | |||
Impairment Losses on Goodwill and Indefinite-Lived Intangible Assets
Under FASB ASC Topic 350 Intangibles—Goodwill and Other, indefinite-lived intangibles, including broadcast licenses, goodwill and mastheads are not amortized but instead are tested for impairment at least annually, or more frequently if events or circumstances indicate that there may be an impairment. We perform our annual impairment testing during the fourth quarter of each year, which coincides with our budget and planning process for the upcoming year. Impairment is measured as the excess of the carrying value of the indefinite-lived intangible asset over its fair value. Intangible assets that have finite useful lives continue to be amortized over their useful lives and are measured for impairment if events or circumstances indicate that they may be impaired. Impairment losses are recorded as operating expenses.
We perform our annual impairment testing during the fourth quarter of each year, which coincides with our budget and planning process for the upcoming year. During our annual testing in the fourth quarter of 2016, we recognized impairment charges of $7.0 million including a $6.5 million impairment of broadcast licenses and $0.5 million impairment of mastheads. Broadcast licenses were deemed to be impaired in four of the twenty-five markets tested. Impairments were recorded in our Cleveland, Dallas, Detroit and Portland market clusters due to an increase in the risk-adjusted discount rate or WACC. Mastheads were deemed to be impaired due to further reductions in projected net revenues and increases in the WACC. We continue to evaluate our print magazine business due to recurring declines in operating results and projected revenues. Due to operating results that did not meet management’s expectations, we ceased publishing Preaching Magazine™, YouthWorker Journal™, FaithTalk Magazine™ and Homecoming™. The Magazine upon issuance of the May 2017 publication. We have received purchase offers from third parties interested in acquiring the rights to continue publishing Preaching Magazine™, but we have not closed on or agreed to final terms of the sale.
| 82 |
Because of the likelihood that these print magazines would be sold or otherwise disposed of before the end of their previously estimated life, we performed impairment tests as of March 31, 2017. Due to reductions in forecasted operating cash flows and indications of interest from potential buyers, we then recorded an impairment charge of $19,000 associated with mastheads.
We believe that our estimate of the value of our broadcast licenses, mastheads, and goodwill is a critical accounting estimate as the value is significant in relation to our total assets, and our estimates incorporate variables and assumptions that are based on past experiences and judgment about future operating performance of our markets and business segments. If actual future results are less favorable than the assumptions and estimates we used, we are subject to future impairment charges, the amount of which may be material. The fair value measurements for our indefinite-lived intangible assets use significant unobservable inputs that reflect our own assumptions about the estimates that market participants would use in measuring fair value including assumptions about risk. The unobservable inputs are defined in FASB ASC Topic 820, Fair Value Measurements and Disclosures, as Level 3 inputs discussed in detail in Note 12.
The valuation of intangible assets is subjective and based on estimates rather than precise calculations. The fair value measurements of our indefinite-lived intangible assets use significant unobservable inputs that reflect our own assumptions about the estimates that market participants would use in measuring fair value including assumptions about risk. If actual future results are less favorable than the assumptions and estimates we used, we are subject to future impairment charges, the amount of which may be material. Given the current economic environment and uncertainties that can negatively impact our business, there can be no assurance that our estimates and assumptions made for the purpose of our indefinite-lived intangible fair value estimates will prove to be accurate.
While the impairment charges we have recognized are non-cash in nature and did not violate the covenants on the then existing Revolver and Term Loan B, the potential for future impairment charges can be viewed as a negative factor with regard to forecasted future performance and cash flows. We believe that we have adequately considered the potential for an economic downturn in our valuation models and do not believe that the non-cash impairments in and of themselves are a liquidity risk.
OFF-BALANCE SHEET ARRANGEMENTS
At December 31, 2017 and 2016, we did not have any relationships with unconsolidated entities or financial partnerships, such as entities often referred to as structured finance or special purpose entities, which would have been established for the purpose of facilitating off-balance sheet arrangements or other contractually narrow or limited purposes. As such, we are not materially exposed to any financing, liquidity, market or credit risk that could arise if we had engaged in such relationships.
CONTRACTUAL OBLIGATIONS
We enter into various agreements in the normal course of business that contain minimum guarantees. The typical minimum guarantee is tied to future revenue amounts that exceed the contractual level. Accordingly, the estimated fair value of these arrangements is zero. We undertake projects from time to time to upgrade our radio station technical facilities and/or FCC broadcast licenses, expand our Internet offerings, improve our facilities and update our computer infrastructures. We expect to incur capital expenditures of approximately $8.8 million throughout the twelve months ending December 31, 2018; the nature and timing of these upgrades and expenditures can be delayed or scaled back at the discretion of management.
The following table summarizes our aggregate contractual obligations at December 31, 2017, and the estimated timing and effect that such obligations are expected to have on our liquidity and cash flow in future periods.
| Payments Due by Period | ||||||||||||||||||||
| Contractual | Less than | 1-3 | 3-5 | More Than 5 | ||||||||||||||||
| Obligations | Total | 1 year | years | years | years | |||||||||||||||
| (Dollars in thousands) | ||||||||||||||||||||
| Long-term debt, including current portion | $ | 264,000 | $ | 9,000 | $ | — | $ | — | $ | 255,000 | ||||||||||
| Interest payments on long-term debt (1) | 112,162 | 17,572 | 35,120 | 35,086 | 24,384 | |||||||||||||||
| Capital lease obligations and other loans | 462 | 109 | 217 | 136 | — | |||||||||||||||
| Operating leases | 88,185 | 13,149 | 23,546 | 18,413 | 33,077 | |||||||||||||||
| Deferred cash payments | — | — | — | — | — | |||||||||||||||
| Contingent earn-out consideration (2) | 69 | 69 | — | — | — | |||||||||||||||
| Talent Agreements (3) | 5,095 | 2,346 | 2,749 | — | — | |||||||||||||||
| Other Contracts (4) | 1,200 | 1,200 | — | — | — | |||||||||||||||
| Reserves for self-insurance | 747 | 747 | — | — | — | |||||||||||||||
| Total contractual cash obligations | $ | 471,920 | $ | 44,192 | $ | 61,632 | $ | 53,635 | $ | 312,461 | ||||||||||
| 83 |
| (1) | Interest payments on long-term debt are based on the outstanding debt and respective interest rates with interest rates on variable-rate debt held constant through maturity at the December 31, 2017 rates. Interest ultimately paid on these obligations will differ based on changes in interest rates for variable-rate debt, as well as any potential repayments or future refinancing. See Note 11 to the accompanying Consolidated Financial Statements included in this annual report on Form 10-K for further details. |
| (2) | Maximum amount of contingent earn-out consideration payable over one year associated with our acquisitions of Portuguese Bible Mobile Applications on June 8, 2017 and TradersCrux.com on July 6, 2017. See Note 5 to the accompanying Consolidated Financial Statements included in this annual report on Form 10-K for further details. |
| (3) | Talent agreements are typically one to three years in length with various renewal dates. The liability shown is based on agreements in effect as of December 31, 2017. Future payments will vary as the agreements are renewed. |
| (4) | Other contracts consist of purchase commitments, including Asset Purchase Agreements (“APA’s”) as of December 31, 2017. |
ITEM 7A. QUANTITATIVE AND QUALITATIVE DISCLOSURES ABOUT MARKET RISK.
DERIVATIVE INSTRUMENTS
We are exposed to market risk from changes in interest rates. We actively monitor these fluctuations and may use derivative instruments primarily for the purpose of reducing the impact of changing interest rates on our variable rate debt and to reduce the impact of changing fair market values on our fixed rate debt. In accordance with our risk management strategy, we use derivative instruments only for the purpose of managing risk associated with an asset, liability, committed transaction, or probable forecasted transaction that is identified by management. Our use of derivative instruments may result in short-term gains or losses that may increase the volatility of our earnings.
Under FASB ASC Topic 815, Derivatives and Hedging, the effective portion of the gain or loss on a derivative instrument designated and qualifying as a cash flow hedging instrument shall be reported as a component of other comprehensive income (outside earnings) and reclassified into earnings in the same period or periods during which the hedged forecasted transaction affects earnings. The remaining gain or loss on the derivative instrument, if any, shall be recognized currently in earnings.
On March 27, 2013, we entered into an interest rate swap agreement with Wells Fargo that began on March 28, 2014 with a notional principal amount of $150.0 million. The agreement was entered to offset risks associated with the variable interest rate on the Term Loan B. Payments on the swap were due on a quarterly basis with a LIBOR floor of 0.625%. The swap was to expire on March 28, 2019 at a fixed rate of 1.645%. The interest rate swap agreement was not designated as a cash flow hedge, and as a result, all changes in the fair value were recognized in the current period statement of operations rather than through other comprehensive income. On May 19, 2017, we paid $0.8 million to terminate the interest rate swap. The swap was valued based on observable inputs for similar assets and liabilities and other observable inputs for interest rates and yield curves, which are classified within Level 2 inputs in the fair value hierarchy described below and in Note 12 to the accompanying Consolidated Financial Statements included in this annual report on Form 10-K for further details.
| December 31, 2016 | December 31, 2017 | |||||||
| (Dollars in thousands) | ||||||||
| Fair value of interest rate swap | $ | 514 | $ | — | ||||
On May 19, 2017, we entered into the ABL Facility. The ABL Facility is a five-year $30.0 million (subject to borrowing base) revolving credit facility maturing on May 19, 2022. Amounts outstanding under the ABL Facility bear interest at a rate based on LIBOR plus a spread of 1.50% to 2.0% per annum based on a pricing grid depending on the average available amount for the most recently ended quarter or at the Base Rate (as defined in the Credit Agreement) plus a spread of 0.50% to 1.0% per annum based on a pricing grid depending on the average available amount for the most recently ended quarter. Additionally, we pay a commitment fee on the unused balance of 0.25% to 0.375% per year. If an event of default occurs, the interest rate may increase by 2.00% per annum. Amounts outstanding under the ABL Facility may be paid and then re-borrowed at our discretion without penalty or premium. As of December 31, 2017, we did not have any outstanding derivative instruments.
FAIR VALUE OF DEBT
On May 19, 2017, we closed on a private offering of $255.0 million aggregate principal amount of 6.75% senior secured notes due 2024 (the “Notes”). The carrying amount of the Notes at December 31, 2017 was $255.0 million, which approximated the fair value based on the prevailing interest rates and trading activity of our Notes.
| 84 |
ITEM 8. FINANCIAL STATEMENTS AND SUPPLEMENTARY DATA.
INDEX TO FINANCIAL STATEMENTS
| 85 |
Report of Independent Registered Public Accounting Firm
Stockholders and the Board of Directors of
Salem Media Group, Inc.
Camarillo, California
Opinion on the Financial Statements
We have audited the accompanying consolidated balance sheets of Salem Media Group, Inc. (the “Company”) as of December 31, 2017 and 2016, the consolidated related statements of operations, stockholders’ equity, and cash flows for the years then ended, and the related notes and financial statement schedule listed in Item 15(a)(2) (collectively referred to as the “financial statements”). In our opinion, the financial statements present fairly, in all material respects, the financial position of the Company as of December 31, 2017 and 2016, and the results of its operations and its cash flows for the years then ended, in conformity with accounting principles generally accepted in the United States of America.
We also have audited, in accordance with the standards of the Public Company Accounting Oversight Board (United States) (“PCAOB”), the Company’s internal control over financial reporting as of December 31, 2017, based on criteria established in Internal Control – Integrated Framework: (2013) issued by the Committee of Sponsoring Organizations of the Treadway Commission (COSO)” and our report dated March 15, 2018 expressed an unqualified opinion.
Basis for Opinion
These financial statements are the responsibility of the Company's management. Our responsibility is to express an opinion on the Company's financial statements based on our audits. We are a public accounting firm registered with the PCAOB and are required to be independent with respect to the Company in accordance with the U.S. federal securities laws and the applicable rules and regulations of the Securities and Exchange Commission and the PCAOB.
We conducted our audits in accordance with the standards of the PCAOB. Those standards require that we plan and perform the audit to obtain reasonable assurance about whether the financial statements are free of material misstatement, whether due to error or fraud. Our audits included performing procedures to assess the risks of material misstatement of the financial statements, whether due to error or fraud, and performing procedures that respond to those risks. Such procedures included examining, on a test basis, evidence regarding the amounts and disclosures in the financial statements. Our audits also included evaluating the accounting principles used and significant estimates made by management, as well as evaluating the overall presentation of the financial statements. We believe that our audits provide a reasonable basis for our opinion.
/s/ Crowe Horwath LLP
We have served as the Company's auditor since 2016.
Sherman Oaks, California
March 15, 2018
| 86 |
REPORT OF INDEPENDENT REGISTERED PUBLIC ACCOUNTING FIRM
To the Stockholders and the Board of Directors of Salem Media Group, Inc.
Opinion on the Financial Statements
We have audited the accompanying consolidated statements of operations, stockholders’ equity, and cash flows for the year ended December 31, 2015, and the related notes to the consolidated financial statements (collectively, the financial statements) of Salem Media Group, Inc. and subsidiaries, (collectively, the “Company”). Our audit also included the financial statement schedule of the Company listed in Item 15(a). In our opinion, the financial statements referred to above present fairly, in all material respects, the results of operations of the Company and its cash flows for the year ended December 31, 2015, in conformity with accounting principles generally accepted in the United States of America.
Basis for Opinion
These financial statements are the responsibility of the Company’s management. Our responsibility is to express an opinion on the Company’s financial statements based on our audit. We are a public accounting firm registered with the Public Company Accounting Oversight Board (United States) (PCAOB) and are required to be independent with respect to the Company in accordance with U.S. federal securities laws and the applicable rules and regulations of the Securities and Exchange Commission and the PCAOB.
We conducted our audit in accordance with the standards of the PCAOB. Those standards require that we plan and perform the audit to obtain reasonable assurance about whether the financial statements are free of material misstatement, whether due to error or fraud.
Our audit included performing procedures to assess the risks of material misstatement of the financial statements, whether due to error or fraud, and performing procedures that respond to those risks. Such procedures included examining, on a test basis, evidence regarding the amounts and disclosures in the financial statements. Our audit also included evaluating the accounting principles used and significant estimates made by management, as well as evaluating the overall presentation of the financial statements. We believe that our audit provides a reasonable basis for our opinion.
/s/ SingerLewak LLP
We served as the company's auditor from June 2007 to June 2016.
Los Angeles, California
March 11, 2016, except for the Revision of Prior Period Consolidated Financial Statements discussed in Note 1, as to which the date is March 15, 2018.
| 87 |
CONSOLIDATED BALANCE SHEETS
(Dollars in thousands, except share and per share data)
| December 31, | ||||||||
| 2016 | 2017 | |||||||
| ASSETS | ||||||||
| Current assets: | ||||||||
| Cash and cash equivalents | $ | 130 | $ | 3 | ||||
| Trade accounts receivable (net of allowances of $10,420 in 2016 and $11,019 in 2017) | 37,260 | 34,843 | ||||||
| Other receivables (net of allowances of $260 in 2016 and $227 in 2017) | 751 | 820 | ||||||
| Inventories (net of reserves of $2,226 in 2016 and $1,657 in 2017) | 670 | 730 | ||||||
| Prepaid expenses | 6,287 | 6,824 | ||||||
| Deferred income taxes | 9,411 | — | ||||||
| Assets held for sale | - | 3,500 | ||||||
| Total current assets | 54,509 | 46,720 | ||||||
| Land held for sale | 1,000 | 1,000 | ||||||
| Notes receivable (net of allowance of $564 in 2016 and $759 in 2017) | 65 | 53 | ||||||
| Property and equipment (net of accumulated depreciation of $156,024 in 2016 and $164,720 in 2017) | 102,790 | 99,480 | ||||||
| Broadcast licenses | 388,517 | 380,914 | ||||||
| Goodwill | 25,613 | 26,424 | ||||||
| Other indefinite-lived intangible assets | 332 | 313 | ||||||
| Amortizable intangible assets (net of accumulated amortization of $44,488 in 2016 and $47,179 in 2017) | 14,408 | 13,104 | ||||||
| Deferred financing costs | 82 | 550 | ||||||
| Deferred income taxes | — | 1,070 | ||||||
| Other assets | 2,952 | 3,191 | ||||||
| Total assets | $ | 590,268 | $ | 572,819 | ||||
| LIABILITIES AND STOCKHOLDERS’ EQUITY | ||||||||
| Current liabilities: | ||||||||
| Accounts payable | $ | 4,968 | $ | 1,584 | ||||
| Accrued expenses | 15,658 | 11,697 | ||||||
| Accrued compensation and related expenses | 8,133 | 7,643 | ||||||
| Accrued interest | 77 | 1,445 | ||||||
| Current portion of deferred revenue | 9,491 | 10,499 | ||||||
| Income taxes payable | 223 | 172 | ||||||
| Current portion of long-term debt and capital lease obligations | 590 | 9,109 | ||||||
| Total current liabilities | 39,140 | 42,149 | ||||||
| Long-term debt and capital lease obligations, less current portion | 261,084 | 249,579 | ||||||
| Fair value of interest rate swap | 514 | — | ||||||
| Deferred income taxes | 63,423 | 34,151 | ||||||
| Deferred rent expense | 9,596 | 9,494 | ||||||
| Deferred revenue less current portion | 5,252 | 6,101 | ||||||
| Other long-term liabilities | 67 | 64 | ||||||
| Total liabilities | 379,076 | 341,538 | ||||||
| Commitments and contingencies (Note 14) | ||||||||
| Stockholders’ Equity: | ||||||||
| Class A common stock, $0.01 par value; authorized 80,000,000 shares; 22,593,130 and 22,932,451 issued and 20,275,480 and 20,614,801 outstanding at December 31, 2016 and 2017, respectively | 226 | 227 | ||||||
| Class B common stock, $0.01 par value; authorized 20,000,000 shares; 5,553,696 issued and outstanding at December 31, 2016 and 2017, respectively | 56 | 56 | ||||||
| Additional paid-in capital | 242,400 | 244,634 | ||||||
| Accumulated earnings | 2,516 | 20,370 | ||||||
| Treasury stock, at cost (2,317,650 shares at December 31, 2016 and 2017) | (34,006 | ) | (34,006 | ) | ||||
| Total stockholders’ equity | 211,192 | 231,281 | ||||||
| Total liabilities and stockholders’ equity | $ | 590,268 | $ | 572,819 | ||||
See accompanying notes
| 88 |
SALEM MEDIA GROUP, INC.
CONSOLIDATED STATEMENTS OF OPERATIONS
(Dollars in thousands, except share and per share data)
| Year Ended December 31, | ||||||||||||
| 2015 | 2016 | 2017 | ||||||||||
| Net broadcast revenue | $ | 197,184 | $ | 202,016 | $ | 196,197 | ||||||
| Net digital media revenue | 44,761 | 46,777 | 43,096 | |||||||||
| Net publishing revenue | 23,842 | 25,528 | 24,443 | |||||||||
| Total net revenue | 265,787 | 274,321 | 263,736 | |||||||||
| Operating expenses: | ||||||||||||
| Broadcast operating expenses, exclusive of depreciation and amortization shown below (including $1,509, $1,663 and $1,705 for the years ended December 31, 2015, 2016 and 2017, respectively, paid to related parties) | 140,819 | 146,283 | 145,494 | |||||||||
| Digital media operating expenses, exclusive of depreciation and amortization shown below | 35,380 | 36,290 | 33,675 | |||||||||
| Publishing operating expenses exclusive of depreciation and amortization shown below | 24,774 | 26,209 | 24,475 | |||||||||
| Unallocated corporate expenses, exclusive of depreciation and amortization shown below (including $133, $301 and $238 for the years ended December 31, 2015, 2016 and 2017, respectively, paid to related parties) | 15,146 | 14,994 | 16,255 | |||||||||
| Depreciation | 12,417 | 12,205 | 12,369 | |||||||||
| Amortization | 5,324 | 5,071 | 4,593 | |||||||||
| Change in the estimated fair value of contingent earn-out consideration | (1,715 | ) | (689 | ) | (23 | ) | ||||||
| Impairment of long-lived assets | — | 700 | — | |||||||||
| Impairment of indefinite-lived long-term assets other than goodwill | — | 7,041 | 19 | |||||||||
| Impairment of goodwill | 439 | 32 | — | |||||||||
| Impairment of amortizable intangible assets | — | 8 | — | |||||||||
| (Gain) loss on the sale or disposal of assets | 181 | (1,901 | ) | 3,905 | ||||||||
| Total operating expenses | 232,765 | 246,243 | 240,762 | |||||||||
| Operating income | 33,022 | 28,078 | 22,974 | |||||||||
| Other income (expense): | ||||||||||||
| Interest income | 8 | 6 | 4 | |||||||||
| Interest expense, net of capitalized interest | (15,429 | ) | (14,938 | ) | (16,706 | ) | ||||||
| Change in the fair value of interest rate swap | (1,273 | ) | 285 | 357 | ||||||||
| Gain on bargain purchase | 1,357 | 95 | — | |||||||||
| Loss on early retirement of long-term debt | (41 | ) | (87 | ) | (2,775 | ) | ||||||
| Net miscellaneous income and (expenses) | 201 | 6 | (80 | ) | ||||||||
| Income from operations before income taxes | 17,845 | 13,445 | 3,774 | |||||||||
| Provision for (benefit from) income taxes | 6,695 | 4,572 | (20,870 | ) | ||||||||
| Net income | $ | 11,150 | $ | 8,873 | $ | 24,644 | ||||||
See accompanying notes
| 89 |
SALEM MEDIA GROUP, INC.
CONSOLIDATED STATEMENTS OF OPERATIONS (CONTINUED)
(Dollars in thousands, except share and per share data)
| Year Ended December 31, | ||||||||||||
| 2015 | 2016 | 2017 | ||||||||||
| Basic earnings per share data: | ||||||||||||
| Basic earnings per share Class A and Class B common stock | $ | 0.43 | $ | 0.34 | $ | 0.94 | ||||||
| Diluted earnings per share data: | ||||||||||||
| Diluted earnings per share Class A and Class B common stock | $ | 0.43 | $ | 0.34 | $ | 0.94 | ||||||
| Distributions per share Class A and Class B common stock | $ | 0.26 | $ | 0.26 | $ | 0.26 | ||||||
| Basic weighted average Class A and Class B shares outstanding | 25,426,732 | 25,669,538 | 26,068,942 | |||||||||
| Diluted weighted average Class A and Class B shares outstanding | 25,887,819 | 26,034,990 | 26,435,757 | |||||||||
See accompanying notes
| 90 |
CONSOLIDATED STATEMENTS OF STOCKHOLDERS’ EQUITY
(Dollars in thousands, except share data)
| Class A | Class B | |||||||||||||||||||||||||||||||
| Common Stock | Common Stock | Additional | Retained | |||||||||||||||||||||||||||||
| Paid-In | Earnings | Treasury | ||||||||||||||||||||||||||||||
| Shares | Amount | Shares | Amount | Capital | (Accumulated Deficit) | Stock | Total | |||||||||||||||||||||||||
| Stockholders’ equity, December 31, 2014 | 22,082,140 | $ | 221 | 5,553,696 | $ | 56 | $ | 239,414 | $ | (4,217 | ) | $ | (34,006 | ) | $ | 201,468 | ||||||||||||||||
| Stock-based compensation | — | — | — | — | 771 | — | — | 771 | ||||||||||||||||||||||||
| Options exercised | 163,994 | 2 | — | — | 383 | — | — | 385 | ||||||||||||||||||||||||
| Tax benefit related to stock options exercised | — | — | — | — | 59 | — | — | 59 | ||||||||||||||||||||||||
| Cash distributions | — | — | — | — | — | (6,612 | ) | — | (6,612 | ) | ||||||||||||||||||||||
| Net income | — | — | — | — | — | 11,150 | — | 11,150 | ||||||||||||||||||||||||
| Stockholders’ equity, December 31, 2015 | 22,246,134 | 223 | 5,553,696 | 56 | 240,627 | 321 | (34,006 | ) | 207,221 | |||||||||||||||||||||||
| Stock-based compensation | — | — | — | — | 582 | — | — | 582 | ||||||||||||||||||||||||
| Options exercised | 336,996 | 3 | — | — | 990 | — | — | 993 | ||||||||||||||||||||||||
| Lapse of restricted shares | 10,000 | — | — | — | — | — | — | — | ||||||||||||||||||||||||
| Tax benefit related to stock options exercised | — | — | — | — | 201 | — | — | 201 | ||||||||||||||||||||||||
| Cash distributions | — | — | — | — | — | (6,678 | ) | — | (6,678 | ) | ||||||||||||||||||||||
| Net income | — | — | — | — | — | 8,873 | — | 8,873 | ||||||||||||||||||||||||
| Stockholders’ equity, December 31, 2016 | 22,593,130 | 226 | 5,553,696 | 56 | 242,400 | 2,516 | (34,006 | ) | 211,192 | |||||||||||||||||||||||
| Stock-based compensation | — | — | — | — | 1,721 | — | — | 1,721 | ||||||||||||||||||||||||
| Options exercised | 127,663 | 1 | — | — | 513 | — | — | 514 | ||||||||||||||||||||||||
| Lapse of restricted shares | 211,658 | — | — | — | — | — | — | — | ||||||||||||||||||||||||
| Cash distributions | — | — | — | — | — | (6,790 | ) | — | (6,790 | ) | ||||||||||||||||||||||
| Net income | — | — | — | — | — | 24,644 | — | 24,644 | ||||||||||||||||||||||||
| Stockholders’ equity, December 31, 2017 | 22,932,451 | $ | 227 | 5,553,696 | $ | 56 | $ | 244,634 | $ | 20,370 | $ | (34,006 | ) | $ | 231,281 | |||||||||||||||||
| 91 |
CONSOLIDATED STATEMENTS OF CASH FLOWS
(Dollars in thousands)
| Year Ended December 31, | ||||||||||||
| 2015 | 2016 | 2017 | ||||||||||
| OPERATING ACTIVITIES | ||||||||||||
| Net income | $ | 11,150 | $ | 8,873 | $ | 24,644 | ||||||
| Adjustments to reconcile net income to net cash provided by operating activities: | ||||||||||||
| Non-cash stock-based compensation | 771 | 582 | 1,721 | |||||||||
| Tax benefit related to stock options exercised | 133 | 255 | — | |||||||||
| Depreciation and amortization | 17,741 | 17,276 | 16,962 | |||||||||
| Amortization of deferred financing costs | 628 | 631 | 940 | |||||||||
| Accretion of financing items | 188 | 206 | 74 | |||||||||
| Accretion of acquisition-related deferred payments and contingent earn-out consideration | 349 | 70 | 42 | |||||||||
| Provision for bad debts | 1,733 | 941 | 2,196 | |||||||||
| Deferred income taxes | 6,313 | 4,089 | (20,932 | ) | ||||||||
| Impairment of long-lived assets | — | 700 | — | |||||||||
| Impairment of indefinite-lived long-term assets other than goodwill | — | 7,041 | 19 | |||||||||
| Impairment of goodwill | 439 | 32 | — | |||||||||
| Impairment of amortizable intangible assets | — | 8 | — | |||||||||
| Change in the fair value of interest rate swap | 1,273 | (285 | ) | (357 | ) | |||||||
| Change in the estimated fair value of contingent earn-out consideration | (1,715 | ) | (689 | ) | (23 | ) | ||||||
| (Gain) loss on the sale or disposal of assets | 181 | (1,901 | ) | 3,905 | ||||||||
| Gain on bargain purchase | (1,357 | ) | (95 | ) | — | |||||||
| Loss on early retirement of debt | 41 | 87 | 2,775 | |||||||||
| Changes in operating assets and liabilities: | ||||||||||||
| Accounts receivable | 1,461 | 4,236 | 144 | |||||||||
| Inventories | (307 | ) | 223 | (60 | ) | |||||||
| Prepaid expenses and other current assets | (705 | ) | (2 | ) | (537 | ) | ||||||
| Accounts payable and accrued expenses | (6,482 | ) | (819 | ) | (3,041 | ) | ||||||
| Deferred rent | 3,745 | 1,330 | (79 | ) | ||||||||
| Deferred revenue | (72 | ) | (4,106 | ) | (1,009 | ) | ||||||
| Other liabilities | 703 | 33 | (3 | ) | ||||||||
| Income taxes payable | (81 | ) | 150 | (51 | ) | |||||||
| Net cash provided by operating activities | 36,130 | 38,866 | 27,330 | |||||||||
| INVESTING ACTIVITIES | ||||||||||||
| Cash paid for capital expenditures net of tenant improvement allowances | (8,833 | ) | (9,414 | ) | (8,534 | ) | ||||||
| Capital expenditures reimbursable under tenant improvement allowances and trade agreements | (3,034 | ) | (620 | ) | (50 | ) | ||||||
| Escrow deposits related to acquisitions | — | (36 | ) | — | ||||||||
| Deposit received under option agreement for radio station sales | — | 450 | — | |||||||||
| Acquisitions of broadcast assets and radio stations | (12,411 | ) | (1,758 | ) | (2,282 | ) | ||||||
| Acquisitions of digital media businesses and assets | (4,472 | ) | (3,253 | ) | (1,690 | ) | ||||||
| Acquisitions of publishing businesses and assets | — | (3,403 | ) | — | ||||||||
| Proceeds from the sale of assets | 10 | 3,147 | 2,456 | |||||||||
| Other | (443 | ) | (606 | ) | (242 | ) | ||||||
| Net cash used in investing activities | (29,183 | ) | (15,493 | ) | (10,342 | ) | ||||||
| FINANCING ACTIVITIES | ||||||||||||
| Payments under Term Loan B | (2,000 | ) | (11,000 | ) | (263,000 | ) | ||||||
| Proceeds from borrowings under Revolver and ABL Facility | 60,219 | 43,909 | 89,738 | |||||||||
| Payments on Revolver and ABL Facility | (58,698 | ) | (46,738 | ) | (81,214 | ) | ||||||
| Payment of interest rate swap | — | — | (783 | ) | ||||||||
| Proceeds from Notes offering | — | — | 255,000 | |||||||||
| Payments of debt issuance costs | — | — | (7,035 | ) | ||||||||
See accompanying notes
| 92 |
SALEM MEDIA GROUP, INC.
CONSOLIDATED STATEMENTS OF CASH FLOWS (CONTINUED)
(Dollars in thousands)
| Year Ended December 31, | ||||||||||||
| 2015 | 2016 | 2017 | ||||||||||
| Payments of acquisition-related contingent earn-out consideration | (1,204 | ) | (111 | ) | (14 | ) | ||||||
| Payments of deferred installments due from acquisition activity | (935 | ) | (3,621 | ) | (225 | ) | ||||||
| Proceeds from the exercise of stock options | 385 | 993 | 514 | |||||||||
| Payment of cash distribution on common stock | (6,612 | ) | (6,678 | ) | (6,790 | ) | ||||||
| Payments on capital lease obligations | (112 | ) | (107 | ) | (122 | ) | ||||||
| Book overdraft | 2,075 | 12 | (3,184 | ) | ||||||||
| Net cash used in financing activities | (6,882 | ) | (23,341 | ) | (17,115 | ) | ||||||
| Net increase (decrease) in cash and cash equivalents | 65 | 32 | (127 | ) | ||||||||
| Cash and cash equivalents at beginning of year | 33 | 98 | 130 | |||||||||
| Cash and cash equivalents at end of year | $ | 98 | $ | 130 | $ | 3 | ||||||
| Supplemental disclosures of cash flow information: | ||||||||||||
| Cash paid during the year for: | ||||||||||||
| Cash paid for interest net of capitalized interest | $ | 14,289 | $ | 14,038 | $ | 14,237 | ||||||
| Cash paid for income taxes | $ | 330 | $ | 78 | $ | 96 | ||||||
| Other supplemental disclosures of cash flow information: | ||||||||||||
| Barter revenue | $ | 6,204 | $ | 5,470 | $ | 5,939 | ||||||
| Barter expense | $ | 5,990 | $ | 5,341 | $ | 5,675 | ||||||
| Non-cash investing and financing activities: | ||||||||||||
| Capital expenditures reimbursable under tenant improvement allowances | $ | 2,998 | $ | 620 | $ | 50 | ||||||
| Non-cash capital expenditures for property & equipment acquired under trade agreements | $ | 36 | $ | — | $ | 39 | ||||||
| Net assets and liabilities assumed non-cash acquisition | $ | — | $ | — | $ | 2,852 | ||||||
| Estimated present value of contingent earn-out consideration | $ | 300 | $ | 66 | $ | — | ||||||
| Current value of deferred cash payments (short-term) | $ | 21 | $ | 1,640 | $ | — | ||||||
| Assets acquired under capital leases | $ | — | $ | — | $ | 16 | ||||||
See accompanying notes
| 93 |
NOTES TO CONSOLIDATED FINANCIAL STATEMENTS
NOTE 1. SUMMARY OF SIGNIFICANT ACCOUNTING POLICIES
Basis of Presentation
The accompanying Consolidated Financial Statements of Salem Media Group, Inc. (“Salem” “we,” “us,” “our” or the “company”) include the company and its wholly owned subsidiaries. All significant intercompany balances and transactions have been eliminated.
Description of Business
Salem is a domestic multimedia company specializing in Christian and conservative content. Our media properties include radio broadcasting, digital media, and publishing entities. We have three operating segments: (1) Broadcast, (2) Digital Media, and (3) Publishing, which are discussed in Note 20 – Segment Data. Our foundational business is radio broadcasting, which includes the ownership and operation of radio stations in large metropolitan markets. We also own and operate Salem Radio Network® (“SRN”), SRN News Network (“SNN”), Today’s Christian Music (“TCM”), Singing News Network and Salem Media RepresentativesTM (“SMR”). SRN, SNN, TCM and Singing News Network are networks that develop, produce and syndicate a broad range of programming specifically targeted to Christian and family-themed talk stations, music stations and general News Talk stations throughout the United States, including Salem-owned and operated stations. SMR, a national advertising sales firm with offices in ten U.S. cities, specializes in placing national advertising on religious and other format commercial radio stations. Each of our radio stations has a website specifically designed for that station from which our audience can access our entire library of digital content and online publications.
Our digital media based businesses provide Christian, conservative, investing and health-themed content, e-commerce, audio and video streaming, and other resources digitally through the web. Salem Web Network™ (“SWN”) websites include Christian content websites; BibleStudyTools.com™, Crosswalk.com®, GodVine.com™, iBelieve.com, GodTube.com™, OnePlace.com™, Christianity.com™, GodUpdates.com, CrossCards.com™, ChristianHeadlines.com, LightSource.com™, AllCreated.com, ChristianRadio.com™, CCMmagazine.com™, SingingNews.com™ and SouthernGospel.com™ and our conservative opinion websites; collectively known as Townhall Media, include Townhall.com™, HotAir.com™, Twitchy.com, RedState.com, BearingArms.com, HumanEvents.com, and ConservativeRadio.com. We also publish digital newsletters through Eagle Financial Publications, which provide market analysis and non-individualized investment strategies from financial commentators on a subscription basis.
Our church e-commerce websites, including SermonSearch.com, ChurchStaffing.com™, WorshipHouseMedia.com, SermonSpice.com™, WorshipHouseKids.com, Preaching.com, ChristianJobs.com™ and Youthworker.com, offer a variety of digital resources including videos, song tracks, sermon archives and job listings to pastors and Church leaders. E-commerce also includes Eagle Wellness, which sells nutritional supplements.
Our web content is accessible through all of our radio station websites that feature content of interest to local audiences throughout the United States.
Our publishing operating segment includes three businesses: (1) Regnery Publishing, a traditional book publisher that has published dozens of bestselling books by leading conservative authors and personalities, including Ann Coulter, Newt Gingrich, David Limbaugh, Ed Klein, Mark Steyn and Dinesh D’Souza; (2) Salem Author Services, a self-publishing service for authors through Xulon Press, Mill City Press and Bookprinting.com; and (3) Singing News® magazine, previously Salem Publishing™ which produces and distributes a print magazine.
Cash and Cash Equivalents
We consider all highly liquid debt instruments, purchased with an initial maturity of three-months or less, to be cash equivalents. The carrying value of our cash and cash equivalents approximated fair value at each balance sheet date.
Trade Accounts Receivable
Trade accounts receivable represent amounts due to us from our customers from revenue generating activities. Our receivables are recorded at the invoiced amount and represent claims that will be settled in cash. The carrying value of our receivables, net of the allowance for doubtful accounts and estimated sales returns, represents their estimated net realizable value. Trade accounts receivable for our self-publishing services represent contractual amounts due under individual payment plans that are adjusted quarterly to exclude unearned or cancellable contracts.
| 94 |
Allowance for Doubtful Accounts
We evaluate the balance reserved in our allowance for doubtful accounts on a quarterly basis based on our historical collection experience, the age of the receivables, specific customer information and current economic conditions. Past due balances are generally not written-off until all collection efforts have been exhausted, including use of a collections agency. A considerable amount of judgment is required in assessing the likelihood of ultimate realization of these receivables, including the current creditworthiness of each customer. If the financial condition of our customers were to deteriorate, resulting in an impairment of their ability to make payments, additional allowances may be required. We have not modified our estimate methodology and we have not historically recognized significant losses from changes in our estimates. We believe that our estimates and assumptions are reasonable and that our reserves are accurately reflected.
Inventory
Inventories consist of finished goods including published books and wellness products. Inventory is recorded at the lower of cost or market as determined on a First-In First-Out (“FIFO”) cost method.
Inventory Reserves
We record a provision to expense the balance of unsold inventory that we believe to be unrecoverable. We review historical data associated with book and wellness product inventories held by Regnery Publishing and our e-commerce wellness entities, as well as our own experiences to estimate the fair value of inventory on hand. Our analysis includes a review of actual sales returns, our allowances, royalty reserves, overall economic conditions and product demand. We regularly monitor actual performance to our estimates and make adjustments as necessary. Estimated inventory reserves may be adjusted, either favorably or unfavorably, if factors such as the historical data we used to calculate these estimates do not properly reflect future returns or as a result of changes in economic conditions of the customer and/or the market. We have not modified our estimate methodology and we have not historically recognized significant losses from changes in our estimates. We believe that our estimates and assumptions are reasonable and that our reserves are accurately reflected.
Property and Equipment
Property and equipment are recorded at cost less accumulated depreciation. Cost represents the historical cost of acquiring the asset, including the costs necessarily incurred to bring it to the condition and location necessary for its intended use. For assets constructed for our own use, such as towers and buildings that are discrete projects for which costs are separately accumulated and for which construction takes considerable time, we record capitalized interest. The amount capitalized is the cost that could have been avoided had the asset not been constructed and is based on the average accumulated expenditures incurred over the capitalization period at the weighted average rate applicable to our outstanding variable rate debt. We capitalized interest of $0.2 million during the years ended December 31, 2017 and 2016. Repair and maintenance costs are charged to expense as incurred. Improvements are capitalized if they extend the life of the asset or enhance the quality or ability of the asset to benefit operations. Depreciation is computed using the straight-line method over estimated useful lives as follows:
| Category | Estimated Life | |
| Buildings | 40 years | |
| Office furnishings and equipment | 5 -10 years | |
| Antennae, towers and transmitting equipment | 10 - 20 years | |
| Studio, production and mobile equipment | 5 - 10 years | |
| Computer software and website development costs | 3 years | |
| Record and tape libraries | 3 years | |
| Automobiles | 5 years | |
| Leasehold improvements | Lesser of the useful life or remaining lease term |
The carrying value of property and equipment is evaluated periodically in relation to the operating performance and anticipated future cash flows of the underlying radio stations and business units for indicators of impairment. When indicators of impairment are present, and the cash flows estimated to be generated from these assets is less than the carrying value, an adjustment to reduce the carrying value to the fair market value of the assets is recorded. See Note 9 – Property and Equipment.
Internally Developed Software and Website Development Costs
We capitalize costs incurred during the application development stage related to the development of internal-use software as specified in the Financial Accounting Standards Board (“FASB”) Accounting Standards Codification (“ASC”) Topic 350-40 Internal-Use Software. Capitalized costs are generally amortized over the estimated useful life of three years. Costs incurred related to the conceptual design and maintenance of internal-use software are expensed as incurred. Website development activities include planning, design and development of graphics and content for new websites and operation of existing sites. Costs incurred that involve providing additional functions and features to the website are capitalized. Costs associated with website planning, maintenance, content development and training are expensed as incurred. We capitalized $3.7 million, $2.3 million and $2.2 million during the years ended December 31, 2017, 2016 and 2015, respectively, related to internally developed software and website development costs. Amortization expense of amounts capitalized was $2.8 million, $2.5 million and $2.4 million for the years ended December 31, 2017, 2016 and 2015, respectively.
| 95 |
Amortizable Intangible Assets
Intangible assets are recorded at cost less accumulated amortization. Typically, intangible assets are acquired in conjunction with the acquisition of broadcast entities, digital media entities and publishing entities. These intangibles are amortized using the straight-line method over the following estimated useful lives:
| Category | Estimated Life | |
| Customer lists and contracts | Lesser of 5 years or the life of contract | |
| Domain and brand names | 5 -7 years | |
| Favorable and assigned leases | Lease Term | |
| Subscriber base and lists | 3 - 7 years | |
| Author relationships | 1 - 7 years | |
| Non-compete agreements | 1 to 5 years |
The carrying value of our amortizable intangible assets are evaluated periodically in relation to the operating performance and anticipated future cash flows of the underlying radio stations and businesses for indicators of impairment. In accordance with FASB ASC Topic 360 Property, Plant and Equipment, when indicators of impairment are present and the undiscounted cash flows estimated to be generated from these assets are less than the carrying amounts of these assets, an adjustment to reduce the carrying value to the fair market value of these assets is recorded, if necessary. During 2016, we recorded an impairment of approximately $8,000 associated with amortizable assets within our wellness products business. No adjustments to the carrying amounts of our amortizable intangible assets were necessary during the year ended December 31, 2017.
Broadcast Licenses
In the case of our broadcast radio stations, we would not be able to operate the properties without the related FCC broadcast license for each property. Broadcast licenses are renewed with the FCC every eight years for a nominal fee that is expensed as incurred. We continually monitor our stations’ compliance with the various regulatory requirements that are necessary for FCC renewal and all of our broadcast licenses have been renewed at the end of their respective periods. We expect all of our broadcast licenses to be renewed in the future and therefore, we consider our broadcast licenses to be indefinite-lived intangible assets. The weighted-average period before the next renewal of our broadcasting licenses is 3.5 years.
We account for broadcast licenses in accordance with FASB ASC Topic 350 Intangibles—Goodwill and Other. We do not amortize broadcast licenses, but rather test for impairment annually or more frequently if events or circumstances indicate that the value may be impaired. We perform our annual impairment testing during the fourth quarter of each year, which coincides with our budget and planning process for the upcoming year.
The unit of accounting we use to test broadcast licenses is the cluster level, which we define as a group of radio stations operating in the same geographic market, sharing the same building and equipment and managed by a single general manager. The cluster level is the lowest level for which discrete financial information and cash flows are available and the level reviewed by management to analyze operating results.
We perform a qualitative assessment for each of our broadcast market clusters. We review the significant assumptions and key estimates applicable to our prior year estimated fair value calculations to assess if events and circumstances have occurred that could affect these assumptions and key estimates. We also review internal benchmarks and the economic performance for each market cluster to assess if it is more likely than not that impairment exists.
The first step of our qualitative assessment is to calculate excess fair value, defined as the amount by which our prior year estimated fair value exceeds the current year carrying value. We believe based on our analysis and review, including the financial performance of each market, that a 25% excess fair value margin is a conservative and reasonable benchmark for our qualitative analysis. Markets with an excess fair value of 25% or more, which have had no significant changes in the prior year assumptions and key estimates, are not likely to be impaired.
The second step of our qualitative assessment consists of a review of the financial operating results for each market cluster. Radio stations are often sold on the basis of a multiple of projected cash flow, or Station Operating Income (“SOI”) defined as net broadcast revenue less broadcast operating expenses. See Item 6 – Selected Financial Data within this annual report for information on SOI, a non-GAAP measure. Numerous trade organizations and analysts review these radio station sales to track SOI multiples applicable to each transaction. Based on published reports and analysis of market transactions, we believe industry benchmarks to be in the six to seven times cash flow range. We elected an SOI benchmark of four as a conservative indicator of fair value.
If the results of our qualitative assessment indicate that the fair value of a reporting unit is less than its carrying value, we perform a quantitative review of the reporting unit. We engage an independent third-party appraisal and valuation firm to assist us with determining the enterprise value as part of this quantitative review.
| 96 |
Goodwill and Other Indefinite-Lived Intangible Assets
We account for goodwill and other indefinite-lived intangible assets in accordance with FASB ASC Topic 350 Intangibles—Goodwill and Other. We do not amortize goodwill and other indefinite-lived intangible assets, but rather test for impairment annually or more frequently if events or circumstances indicate that an asset may be impaired. We perform our annual impairment testing during the fourth quarter of each year, which coincides with our budget and planning process for the upcoming year.
The unit of accounting we use to test goodwill associated with our radio stations is the cluster level, which we define as a group of radio stations operating in the same geographic market, sharing the same building and equipment and managed by a single general manager. Nineteen of our 34 market clusters have goodwill associated with them as of our annual testing period ended December 31, 2017.
The unit of accounting we use to test goodwill in our radio networks is the entity level, which includes Salem Radio Network® (“SRN”), SRN News Network (“SNN”), Todays Christian Music (“TCM”) and Singing News Network. The entity level is the level reviewed by management for which discrete financial information is available. One of our five networks has goodwill associated with it as of our annual testing period ended December 31, 2017.
The unit of accounting we use to test goodwill in our digital media segment is the entity level, which includes Salem Web Network, Townhall.com, and Eagle Financial Publications. The financial statements for Salem Web Network reflect the operating results and cash flows for our Christian content websites and our church product websites. The financial statements for Townhall.com reflect the operating results for each of our conservative opinion websites. Eagle Financial Publications include our investing websites and related digital publications.
The unit of accounting we use to test goodwill in our publishing segment is the entity level, which includes Regnery Publishing and Salem Author Services. Regnery Publishing is a book publisher based in Washington DC, that operates from a stand-alone facility under one general manager, with operating results and cash flows of reported at the entity level. Salem Author Services operates from a stand-alone facility in Orlando, Florida under one general manager who is responsible for the operating results and cash flows.
We perform a qualitative assessment to determine if events and circumstances have occurred that indicate it is more likely than not that the fair value of the assets, including goodwill, are less than their carrying values. We review the significant inputs used in our prior year fair value estimates to determine if any changes to those inputs should be made. We estimate the fair value using a market approach and compare the estimated fair value of each entity to its carrying value, including goodwill. Under the market approach, we apply a multiple of four to each entities operating income to estimate the fair value. We believe that a multiple of four is a conservative indicator of fair value as described above.
If the results of our qualitative assessment indicate that the fair value of a reporting unit is less than its carrying value, we perform a quantitative review of the reporting unit. We engage an independent third-party appraisal and valuation firm to assist us with determining the enterprise value as part of this quantitative review.
Other Indefinite-Lived Intangible Assets
Mastheads consist of the graphic elements that identify our publications to readers and advertisers. These include customized typeset page headers, section headers, and column graphics as well as other name and identity stylized elements within the body of each publication. We test the value of mastheads as a single combined publishing entity as our print magazines operate from one shared facility under one general manager with operating results and cash flows reported on a combined basis for all publications. This is the lowest level for which discrete financial information and cash flows are available and the level reviewed by management to analyze operating results.
Business Acquisitions
We account for business acquisitions in accordance with the acquisition method of accounting as specified in FASB ASC Topic 805 Business Combinations. The total acquisition consideration is allocated to assets acquired and liabilities assumed based on their estimated fair values as of the date of the transaction. Estimates of the fair value include discounted estimated cash flows to be generated by the assets and their expected useful lives based on historical experience, market trends and any synergies believed to be achieved from the acquisition. The excess of consideration paid over the estimated fair values of the net assets acquired is recorded as goodwill and any excess of fair value of the net assets acquired over the consideration paid is recorded as a gain on bargain purchase. Prior to recording a gain, the acquiring entity must reassess whether all acquired assets and assumed liabilities have been identified and recognized and perform re-measurements to verify that the consideration paid, assets acquired, and liabilities assumed have been properly valued. We underwent such a reassessment, and as a result, recorded a pre-tax gain on bargain purchase of $0.1 million for KXFN-AM in St. Louis, Missouri during the year ended December 31, 2016. During the year ended December 31, 2015 recorded a pre-tax gain on bargain purchase of $1.4 million, including $0.8 million for WSDZ-AM in St. Louis, Missouri, $0.3 million for KDIZ-AM in Minneapolis, Minnesota, and $0.3 million for WWMI-AM in Tampa, Florida. We believe that these gains on bargain purchase resulted from various factors that may have impacted the acquisition price, including, without limitation, that Disney was eager to divest of their Radio Disney properties in 2015 and the seller of WSDZ-AM was under a receivership.
| 97 |
Acquisitions may include contingent earn-out consideration, the fair value of which is estimated as of the acquisition date as the present value of the expected contingent payments as determined using weighted probabilities of the payment amounts. See Note 4 – Acquisitions and Recent Transactions and Note 5 – Contingent Earn-Out Consideration.
A majority of our radio station acquisitions have consisted primarily of the FCC licenses to broadcast in a particular market. We often do not acquire the existing format, or we change the format upon acquisition when we find it beneficial. As a result, a substantial portion of the purchase price for the assets of a radio station is allocated to the broadcast license.
We may retain a third-party appraiser to estimate the fair value of the acquired net assets as of the acquisition date. As part of the valuation and appraisal process, the third-party appraiser prepares a report assigning estimated fair values to the various asset categories in our financial statements. These fair value estimates are subjective in nature and require careful consideration and judgment. Management reviews the third party reports for reasonableness of the assigned values. We believe that the purchase price allocations represent the appropriate estimated fair value of the assets acquired and we have not had to modify our purchase price allocations.
We estimate the economic life of each tangible and intangible asset acquired to determine the period of time in which the asset should be depreciated or amortized. A considerable amount of judgment is required in assessing the economic life of each asset. We consider our own experience with similar assets, industry trends, market conditions and the age of the property at the time of our acquisition to estimate the economic life of each asset. If the financial condition of the assets were to deteriorate, the resulting change in life or impairment of the asset could cause a material impact and volatility in our operating results. To date, we have not experienced changes in the economic life established for each major category of our assets.
Property and equipment are recorded at their estimated fair value and depreciated on a straight-line basis over their estimated useful lives. Finite-lived intangible assets are recorded at their estimated fair value and amortized on a straight-line basis over their estimated useful lives. Costs associated with acquisitions, such as consulting and legal fees, are expensed as incurred in unallocated corporate operating expenses.
Contingent Earn-Out Consideration
Our acquisitions may include contingent earn-out consideration as part of the purchase price under which we will make future payments to the seller upon the achievement of certain benchmarks. The fair value of the contingent earn-out consideration is estimated as of the acquisition date at the present value of the expected contingent payments to be made using a probability-weighted discounted cash flow model for probabilities of possible future payments. The present value of the expected future payouts is accreted to interest expense over the earn-out period. The fair value estimates use unobservable inputs that reflect our own assumptions as to the ability of the acquired business to meet the targeted benchmarks and discount rates used in the calculations. The unobservable inputs are defined in FASB ASC Topic 820, Fair Value Measurements and Disclosures, as Level 3 inputs discussed in detail in Note 12.
We review the probabilities of possible future payments to the estimated fair value of any contingent earn-out consideration on a quarterly basis over the earn-out period. Actual results are compared to the estimates and probabilities of achievement used in our forecasts. Should actual results of the acquired business increase or decrease as compared to our estimates and assumptions, the estimated fair value of the contingent earn-out consideration liability will increase or decrease, up to the contracted limit, as applicable. Changes in the estimated fair value of the contingent earn-out consideration are reflected in our results of operations in the period in which they are identified. Changes in the estimated fair value of the contingent earn-out consideration may materially impact and cause volatility in our operating results.
We recorded a net decrease to our estimated contingent earn-out liabilities of $23,000 for the year ended December 31, 2017 and net decrease of $689,000 during the prior year. The changes in our estimates reflect volatility from variables, such as revenue growth, page views and session time as discussed in Note 5 – Contingent Earn-Out Consideration.
Discontinued Operations
We regularly review underperforming assets to determine if a sale or disposal might be a better way to monetize the assets. When a station, group of stations, or other asset group is considered for sale or disposal, we review the transaction to determine if or when the entity qualifies as a discontinued operation in accordance with the criteria of FASB ASC Topic 205-20 Discontinued Operations.
Revenue Recognition
Revenue is recognized as it is earned in accordance with applicable guidelines. We consider amounts to be earned once evidence of an arrangement has been obtained, services are performed, fees are fixed or determinable and collectability is reasonably assured.
| 98 |
We account for broadcast revenue from the sale of airtime for programs or spots as the program or advertisement is broadcast. Revenues are reported net of agency commissions, which are calculated as a stated percentage applied to gross billings. Digital revenue is recognized upon delivery of page-views, delivery of impressions as specified in the contract, delivery of the digital newsletter or email, or upon delivery of the advertisement or programming content via streaming. Revenues are reported net of agency commissions, which are calculated as a stated percentage applied to gross billings. Revenue from product sales and book sales are recognized upon shipment net of distribution fees and an allowance for sales returns. Revenues from advertisements in our print magazines are recognized upon delivery of the publication net of agency commissions, which are calculated as a stated percentage applied to gross billings. Subscription revenue from our print magazines and digital newsletters is recognized over the life of the related subscription.
Revenue Recognition for Multiple-Deliverables
We enter bundled advertising agreements that may include cross-promotions such as advertisements on our radio stations, digital banners, print magazine placements, booth space at local events, or some combination thereof. The multiple deliverables contained in each agreement are accounted for separately over their respective delivery period provided that they are separate units of accounting. The selling price for each deliverable is based on vendor specific objective evidence, if available, or the estimated fair value of each deliverable. Objective evidence of the fair value includes the price charged for each element when sold separately or the price that we would transact if the deliverable is sold regularly on a standalone basis. Arrangement consideration is allocated at the inception of each agreement to all deliverables using the relative selling price method. The relative selling price method allocates any discount in the arrangement proportionally to each deliverable on the basis of each deliverable’s selling price.
Sales Returns
We provide for estimated returns for products sold with the right of return, primarily book sales associated with Regnery Publishing and nutritional products sold through Eagle Wellness and Gene Smart. We record an estimate of these product returns as a reduction of revenue in the period of the sale. Our estimates are based upon historical sales returns, the amount of current period sales, economic trends and any changes in customer demand and acceptance of our products. We regularly monitor actual performance to estimated return rates and make adjustments as necessary. Estimated return rates utilized for establishing estimated returns reserves have approximated actual returns experience. However, actual returns may differ significantly, either favorably or unfavorably, from these estimates if factors such as the historical data we used to calculate these estimates do not properly reflect future returns or as a result of changes in economic conditions of the customer and/or the market. We have not modified our estimate methodology and we have not recognized significant losses from changes in our estimates
Barter Transactions
We may provide broadcast time or digital advertising placement to customers in exchange for certain products, supplies or services. The terms of these exchanges generally permit for the preemption of such broadcast time or digital placements in favor of customers who purchase these items for cash. We include the value of such exchanges in net revenues and operating expenses. The value recorded for barter revenue and barter expense is based upon management’s estimate of the fair value of the products, supplies or services received. We believe that our estimates and assumptions are reasonable and that our barter revenue and barter expense are accurately reflected.
We record barter revenue as it is earned, typically when the broadcast time is used or the digital advertisement is delivered. We record barter expense equal to the estimated fair value of the goods or services received upon receipt or usage of the items as applicable. Barter revenue included in broadcast revenue for the years ended December 31, 2017, 2016 and 2015 was approximately $5.8 million, $5.4 million and $6.1 million, respectively. Barter expenses included in broadcast operating expense for the years ended December 31, 2017, 2016 and 2015 were approximately $5.6 million, $5.3 million and $5.9 million, respectively. Barter revenue included in digital media revenue for the years ended December 31, 2017, 2016 and 2015 was approximately $0.1 million, $42,000 and $0.1 million, respectively. Barter expenses included in digital media operating expense for the years ended December 31, 2017, 2016 and 2015 were approximately $0.1 million, $34,000 and $0.1 million, respectively.
Stock-Based Compensation
We account for stock-based compensation under the provisions of Financial Accounting Standards Board (“FASB”) Accounting Standards Codification (“ASC”) Topic 718, Compensation—Stock Compensation. We record equity awards with stock-based compensation measured at the fair value of the award as of the grant date. We determine the fair value of our options using the Black-Scholes option-pricing model that requires the input of highly subjective assumptions, including the expected stock price volatility and expected term of the options granted. The exercise price for options is equal to the closing market price of Salem Media Group common stock as of the date of grant. We use the straight-line attribution method to recognize share-based compensation costs over the expected service period of the award. Upon exercise, cancellation, forfeiture, or expiration of stock options, or upon vesting or forfeiture of restricted stock awards, deferred tax assets for options and restricted stock awards with multiple vesting dates are eliminated for each vesting period on a first-in, first-out basis as if each vesting period was a separate award. See Note 15 – Stock Incentive Plan.
| 99 |
Advertising and Promotional Cost
Costs of media advertising and associated production costs are expensed as incurred and amounted to approximately $12.0 million, $12.3 million and $11.3 million for each of the years ended December 31, 2017, 2016 and 2015, respectively.
Leases
We lease broadcast towers, transmitter sites and office space throughout the United States. We review each lease agreement upon inception to determine the appropriate classification of the lease as a capital lease or operating lease based on the factors listed in FASB ASC Topic 840 Leases. Our current lease terms generally range from one to twenty-five years with rent expense recorded on a straight-line basis for financial reporting purposes. Where leases include rent holidays, rent escalations, rent concessions and leasehold improvement incentives, the value of these incentives are amortized over the lease term including anticipated renewal periods. Rent expense, exclusive of intercompany leases eliminated during consolidation, was $15.5 million, $15.3 million and $14.8 million, respectively, for each of the years ended December 31, 2017, 2016 and 2015.
Deferred rental revenue was $4.3 million as of December 31, 2017 and 2016.
Leasehold Improvements
We may construct or otherwise invest in leasehold improvements to properties. The costs of these leasehold improvements are capitalized and depreciated over the shorter of the estimated useful life of the improvement or the lease term including anticipated renewal periods.
Partial Self-Insurance on Employee Health Plan
We provide health insurance benefits to eligible employees under a self-insured plan whereby we pay actual medical claims subject to certain stop loss limits. We record self-insurance liabilities based on actual claims filed and an estimate of those claims incurred but not reported. Our estimates are based on historical data and probabilities. Any projection of losses concerning our liability is subject to a high degree of variability. Among the causes of this variability are unpredictable external factors such as future inflation rates, changes in severity, benefit level changes, medical costs and claim settlement patterns. Should the actual amount of claims increase or decrease beyond what was anticipated, we may adjust our future reserves. Our self-insurance liability was $0.7 million and $0.8 million at December 31, 2017 and 2016, respectively. We have not modified our estimate methodology and we have not historically recognized significant losses from changes in our estimates. While we had an unusually high level of claims in the third quarter of 2016 due to a larger than normal number of expensive claims, we believe that our estimates and assumptions are reasonable and that our reserves are accurately reflected.
The following table presents the changes in our partial self-insurance reserves.
| Year Ended December 31, | ||||||||
| 2016 | 2017 | |||||||
| (Dollars in thousands) | ||||||||
| Balance, beginning of period | $ | 676 | $ | 783 | ||||
| Self-funded costs | 9,526 | 9,735 | ||||||
| Claims paid | (9,419 | ) | (9,771 | ) | ||||
| Ending period balance | $ | 783 | $ | 747 | ||||
Derivative Instruments
We are exposed to market risk from changes in interest rates. We actively monitor these fluctuations and may use derivative instruments primarily for the purpose of reducing the impact of changing interest rates on our variable rate debt and to reduce the impact of changing fair market values on our fixed rate debt. In accordance with our risk management strategy, we may use derivative instruments only for the purpose of managing risk associated with an asset, liability, committed transaction, or probable forecasted transaction that is identified by management. Our use of derivative instruments may result in short-term gains or losses that may increase the volatility of our earnings.
Under FASB ASC Topic 815, Derivatives and Hedging, the effective portion of the gain or loss on a derivative instrument designated and qualifying as a cash flow hedging instrument shall be reported as a component of other comprehensive income (outside earnings) and reclassified into earnings in the same period or periods during which the hedged forecasted transaction affects earnings. The remaining gain or loss on the derivative instrument, if any, shall be recognized currently in earnings.
On March 27, 2013, we entered into an interest rate swap agreement with Wells Fargo that began on March 28, 2014 with a notional principal amount of $150.0 million. The agreement was entered to offset risks associated with the variable interest rate on the Term Loan B. Payments on the swap were due on a quarterly basis with a LIBOR floor of 0.625%. The swap was to expire on March 28, 2019 at a fixed rate of 1.645%. The interest rate swap agreement was not designated as a cash flow hedge, and as a result, all changes in the fair value were recognized in the current period statement of operations rather than through other comprehensive income. On May 19, 2017, we paid $0.8 million to terminate the interest rate swap. As of December 31, 2017, we did not have any outstanding derivative instruments.
| 100 |
| December 31, 2016 | December 31, 2017 | |||||||
| (Dollars in thousands) | ||||||||
| Fair value of interest rate swap | $ | 514 | $ | — | ||||
On May 19, 2017, we entered into a new senior credit facility, which is an asset-based revolving credit facility (“ABL Facility”). The ABL Facility is a five-year $30.0 million (subject to borrowing base) revolving credit facility maturing on May 19, 2022. Amounts outstanding under the ABL Facility bear interest at a rate based on LIBOR plus a spread of 1.50% to 2.0% per annum based on a pricing grid depending on the average available amount for the most recently ended quarter or at the Base Rate (as defined in the Credit Agreement) plus a spread of 0.50% to 1.0% per annum based on a pricing grid depending on the average available amount for the most recently ended quarter. Additionally, we pay a commitment fee on the unused balance of 0.25% to 0.375% per year. If an event of default occurs, the interest rate may increase by 2.00% per annum. Amounts outstanding under the ABL Facility may be paid and then re-borrowed at our discretion without penalty or premium.
Fair Value Measurements and Disclosures
As of December 31, 2017, the carrying value of cash and cash equivalents, trade accounts receivables, accounts payable, accrued expenses and accrued interest approximates fair value due to the short-term nature of such instruments. The carrying value of the ABL approximates fair value as the related interest rates approximate rates currently available to the company. The carrying amount of the Notes at December 31, 2017 was $255.0 million, which approximated the fair value based on the prevailing interest rates and trading activity of our Notes. See Note 12 – Fair Value Measurements and Disclosures.
Long-term Debt and Debt Covenant Compliance
Our classification of outstanding borrowings on our Notes as long-term debt on our balance sheet is based on our assessment that, under the Indenture and after considering our projected operating results and cash flows for the coming year, no principal payments are required to be made within the next twelve months. The Notes have a term of seven years, maturing on June 1, 2024. We may redeem the Notes, in whole or in part, at any time on or after June 1, 2020 at a price equal to 100% of the principal amount of the Notes plus a “make-whole” premium as of, and accrued and unpaid interest, if any, to, but not including, the redemption date. At any time on or after June 1, 2020, we may redeem some or all of the Notes at the redemption prices (expressed as percentages of the principal amount to be redeemed) set forth in the Notes, plus accrued and unpaid interest, if any, to, but not including, the redemption date. In addition, we may redeem up to 35% of the aggregate principal amount of the Notes before June 1, 2020 with the net cash proceeds from certain equity offerings at a redemption price of 106.75% of the principal amount plus accrued and unpaid interest, if any, to, but not including, the redemption date. We may also redeem up to 10% of the aggregate original principal amount of the Notes per twelve month period before June 1, 2020 at a redemption price of 103% of the principal amount plus accrued and unpaid interest to, but not including, the redemption date.
We report outstanding balances on the ABL Facility as short-term regardless of the maturity date based on use of the ABL Facility to fund ordinary and customary operating cash needs with frequent repayments.
Our projections of operating results and cash flows for the coming year are estimates dependent upon a number of factors including but not limited to developments in the markets in which we are operating in and varying economic and political factors. Accordingly, these projections are inherently uncertain and our actual results could differ from these estimates.
Deferred Financing Costs
We adopted ASU 2015-03, as amended by ASU 2015-15, as of the effective date of January 1, 2016. Debt issue costs are being amortized to non-cash interest expense over the life of the Term Loan B using the effective interest method. We chose to continue presentation of debt issue costs associated with our Revolver as an asset in accordance with ASU 2015-15. We have retrospectively accounted for the implementation of ASU 2015-03 and ASU 2015-15 as a change in accounting principle. Costs of the Revolver are being amortized to non-cash interest expense over the five year life of the Revolver using the effective interest method based on an imputed interest rate of 4.58%.
On May 19, 2017, we closed on a private offering of $255.0 million aggregate principal amount of 6.75% senior secured notes due 2024 (the “Notes”) and concurrently entered into a five-year $30.0 million senior secured asset-based revolving credit facility, which includes a $5.0 million subfacility for standby letters of credit and a $7.5 million subfacility for swingline loans (“ABL Facility”) due May 19, 2022. The net proceeds from the offering of the Notes, together with borrowings under the ABL Facility, were used to repay outstanding borrowings, including accrued and unpaid interest, on our previously existing senior credit facilities consisting of a term loan (“Term Loan B”) and a revolving credit facility of $25.0 million (“Revolver”), and to pay fees and expenses incurred in connection with the Notes offering and the ABL Facility (collectively, the “Refinancing”).
| 101 |
We incurred debt issuance costs of $6.3 million that were recorded as a reduction of the Note proceeds that are being amortized to non-cash interest expense over the life of the Notes using the effective interest method. We incurred debt issue costs of $0.7 million that were recorded as an asset and are being amortized to non-cash interest expense over the term of the ABL Facility using the effective interest method. See Note 11 – Long-Term Debt.
Income Tax Valuation Allowances (Deferred Taxes)
We account for income taxes in accordance with FASB ASC Topic 740 Income Taxes. In preparing our consolidated financial statements, we estimate our income tax liability in each of the jurisdictions in which we operate by estimating our actual current tax exposure and assessing temporary differences resulting from differing treatment of items for tax and financial statement purposes. We calculate our current and deferred tax provisions based on estimates and assumptions that could differ from the actual results reflected in income tax returns filed during the subsequent year. Adjustments based on filed returns are generally recorded in the period when the tax returns are filed and the tax implications are known. Tax law and rate changes are reflected in the income tax provision in the period in which such changes are enacted.
We record a valuation allowance to reduce our deferred tax assets to the amount that is more likely than not to be realized. We consider all available evidence, both positive and negative, including historical levels of income, expectations and risks associated with estimates of future taxable income and ongoing prudent and feasible tax planning strategies in assessing the need for a valuation allowance. In the event we were to determine that we would not be able to realize all or part of our net deferred tax assets in the future, an adjustment to the deferred tax assets would be charged to earnings in the period in which we make such a determination. Likewise, if we later determine that it is more likely than not that the net deferred tax assets would be realized, we would reverse the applicable portion of the previously provided valuation allowance.
For financial reporting purposes, we recorded a valuation allowance of $6.2 million as of December 31, 2017 to offset $6.0 million of the deferred tax assets related to the state net operating loss carryforwards and $0.2 million associated with asset impairments. During the third quarter of 2016, we identified an error in our estimated valuation allowance for certain deferred tax assets. For financial reporting purposes, we recorded a valuation allowance of $4.5 million as of December 31, 2016 to offset $4.2 million of the deferred tax assets related to the state net operating loss carryforwards and $0.3 million associated with asset impairments. We believe that our estimates and assumptions are reasonable and that our reserves are accurately reflected.
On December 22, 2017, the Tax Cuts and Jobs Act of 2017 (the “Act”) was signed into law making significant changes to the Internal Revenue Code. Changes include, but are not limited to, a corporate tax rate decrease from 35% to 21% effective for tax years beginning after December 31, 2017. We have calculated our best estimate of the impact of the Act in our year end income tax provision in accordance with our understanding of the Act and guidance available as of the date of this filing.
The SEC issued Staff Accounting Bulletin No. 118 (“SAB 118”) to address the application of US GAAP in situations when a registrant does not have the necessary information available, prepared, or analyzed (including computations) in reasonable detail to complete the accounting for certain income tax effects of the Act. SAB 118 summarizes a three-step process to be applied at each reporting period to account for and qualitatively disclose: (1) the effects of the change in tax law for which accounting is complete; (2) provisional amounts (or adjustments to provisional amounts) for the effects of the tax law where accounting is not complete, but that a reasonable estimate has been determined; and (3) a reasonable estimate cannot yet be made and therefore taxes are reflected in accordance with law prior to the enactment of the Tax Cuts and Jobs Act.
Amounts recorded where we consider accounting to be complete for the year ended December 31, 2017 principally relate to the reduction in the U.S. corporate income tax rate to 21%, which resulted in the recording of an income tax benefit of $23.0 million to remeasure deferred taxes liabilities associated primarily with intangible assets that are deemed to reverse at the new 21% tax rate.
Other significant provisions that are not yet effective but may impact income taxes in future years include include limitations on the current deductibility of net interest expense, limitation of net operating losses generated after fiscal 2018 to 80% of taxable income, acceleration of tax revenue recognition and additional limitation on executive compensation.
Income Taxes and Uncertain Tax Positions
We are subject to audit and review by various taxing jurisdictions. We may recognize liabilities on our financial statements for positions taken on uncertain tax positions. When tax returns are filed, it is highly certain that some positions taken would be sustained upon examination by the taxing authorities, while others may be subject to uncertainty about the merits of the position taken or the amount of the position that would be ultimately sustained. The benefit of a tax position is recognized in the financial statements in the period during which, based on all available evidence, we believe it is more likely than not that the position will be sustained upon examination, including the resolution of appeals or litigation processes, if any. Such positions are deemed to be unrecognized tax benefits and a corresponding liability is established on the balance sheet. It is inherently difficult and subjective to estimate such amounts, as this requires us to make estimates based on the various possible outcomes.
| 102 |
We review and reevaluate uncertain tax positions on a quarterly basis. Changes in assumptions may result in the recognition of a tax benefit or an additional charge to the tax provision. During the year ended December 31, 2017, we did not have any material unrecognized tax benefits recorded. During the year ended December 31, 2016, we recognized a net decrease of $0.1 million in liabilities associated with uncertain tax positions. Accordingly, we have no liabilities for uncertain tax positions recorded at December 31, 2016. The $0.1 million balance at December 31, 2015 included approximately $21,000 of accrued interest, net of federal income tax benefits, and $6,000 for the related penalties previously recorded in income tax expense. Our evaluation was performed for all tax years that remain subject to examination, which range from 2013 through 2016. There are currently no tax examinations in process. In August 2017, we received a letter notifying us that the City of New York is initiating an audit of our tax returns for years 2013 and 2014. As of fourth quarter, we are still in the early stages of the audit. We do not anticipate the outcome to be material nor significant.
Effective Tax Rate
Our provision for income tax as a percentage of operating income before taxes, or our effective tax rate, may be impacted by:
| (1) | changes in the level of income in any of our taxing jurisdictions; |
| (2) | changes in statutes and rules applicable to taxable income in the jurisdictions in which we operate; |
| (3) | changes in the expected outcome of income tax audits; |
| (4) | changes in the estimate of expenses that are not deductible for tax purposes; |
| (5) | income taxes in certain states where the states’ current taxable income is dependent on factors other than consolidated net income; |
| (6) | the addition of operations in states that on average have different income tax rates from states in which we currently operate, and |
| (7) | the effect of previously reported temporary differences between the and financial reporting bases of assets and liabilities. |
Our annual effective tax rate may also be materially impacted by tax expense associated with non-amortizable assets such as broadcast licenses and goodwill as well as changes in the deferred tax valuation allowance. An impairment loss for financial statement purposes will result in an income tax benefit during the period incurred as the amortization of broadcasting licenses and goodwill is deductible for income tax purposes.
Reserves for Royalty Advances
Royalties due to book authors are paid in advance and capitalized. Royalties are expensed as the related book revenues are earned or when we determine that future recovery of the royalty is not likely. We reviewed historical data associated with royalty advances, earnings and recoverability based on actual results of Regnery Publishing. Historically, the longer the unearned portion of an advance remains outstanding, the less likely it is that we will recover the advance through the sale of the book. We apply this historical experience to outstanding royalty advances to estimate the likelihood of recovery. A provision was established to expense the balance of any unearned advance which we believe is not recoverable. Our analysis also considers other discrete factors, such as death of an author, any decision to not pursue publication of a title, poor market demand or other relevant factors. We have not modified our estimate methodology and we have not historically recognized significant losses from changes in our estimates. We believe that our estimates and assumptions are reasonable and that our reserves are accurately reflected.
Contingency Reserves
In the ordinary course of business, we are involved in various legal proceedings, lawsuits, arbitration and other claims which are complex in nature and have outcomes that are difficult to predict. Consequently, we are unable to ascertain the ultimate aggregate amount of monetary liability or the financial impact with respect to these matters.
We record contingency reserves to the extent we conclude that it is probable that a liability has been incurred and the amount of the related loss can be reasonably estimated. The establishment of the reserve is based on a review of all relevant factors, the advice of legal counsel, and the subjective judgment of management. The reserves we have recorded to date have not been material to our consolidated financial position, results of operations or cash flows. We believe that our estimates and assumptions are reasonable and that our reserves are accurately reflected.
While we believe that the final resolution of any known maters, individually and in the aggregate, will not have a material adverse effect upon our consolidated financial position, results of operations or cash flows, it is possible that we could incur additional losses. We maintain insurance that may provide coverage for such matters. Future claims against us, whether meritorious or not, could have a material adverse effect upon our consolidated financial position, results of operations or cash flows, including losses due to costly litigation and losses due to matters that require significant amounts of management time that can result in the diversion of significant operational resources. See Note 14 – Commitments and Contingencies.
| 103 |
(Gain) Loss on the Sale or Disposal of Assets
We record gains or losses on the sale or disposal of assets equal to the proceeds, if any, as compared to the net book value. Exchange transactions are accounted for in accordance with FASB ASC Topic 845 Non-Monetary Transactions. During the year ended December 31, 2017, we recorded a $3.9 million pre-tax loss, including a $4.7 million estimated loss for the pending sale of WQVN-AM (formerly WKAT-AM) in Miami, Florida, a $77,000 loss related to transmitter equipment in Dallas, Texas that was no longer in use and a $2,000 net loss for equipment damaged in our Tampa, Florida market as a result of hurricane Irma in September 2017 that was offset by a $0.5 million gain from the sale of a former transmitter site in our Dallas, Texas market, a $0.4 million gain on the sale of the WSPZ-AM tower site, and a $16,000 net gain from disposals within our print magazine segment.
During the year ended December 31, 2016, we recorded a $1.9 million pre-tax gain which included a $1.9 million gain on the sale of our Miami tower site and a $0.7 million gain from a land easement in our South Carolina market offset by a $0.4 million charge associated with leasehold improvements that were abandoned during the relocation of our offices in Washington D.C. market and various fixed asset disposals.
During the year ended December 31, 2015, we recorded a $0.2 million pre-tax loss that included a $0.2 million charge associated with the relocation of our office and studio in our Seattle, Washington market offset by proceeds from various fixed asset and equipment disposals.
Basic and Diluted Net Earnings Per Share
Basic net earnings per share has been computed using the weighted average number of Class A and Class B shares of common stock outstanding during the period. Diluted net earnings per share is computed using the weighted average number of shares of Class A and Class B common stock outstanding during the period plus the dilutive effects of stock options.
Options to purchase 1,428,462, 1,720,000 and 1,581,123 shares of Class A common stock were outstanding at December 31, 2017, 2016 and 2015, respectively. Diluted weighted average shares outstanding exclude outstanding stock options whose exercise price is in excess of the average price of the company’s stock price. These options are excluded from the respective computations of diluted net income or loss per share because their effect would be anti-dilutive. The number of anti-dilutive shares as of December 31, 2017, 2016 and 2015 was 814,556, 795,378 and 589,437, respectively.
The following table sets forth the shares used to compute basic and diluted net earnings per share for the periods indicated:
| Year Ended December 31, | ||||||||||||
| 2015 | 2016 | 2017 | ||||||||||
| Weighted average shares | 25,426,732 | 25,669,538 | 26,068,942 | |||||||||
| Effect of dilutive securities - stock options | 461,087 | 365,452 | 366,815 | |||||||||
| Weighted average shares adjusted for dilutive securities | 25,887,819 | 26,034,990 | 26,435,757 | |||||||||
Segments
We have three operating segments: (1) Broadcast, (2) Digital Media, and (3) Publishing, which also qualify as reportable segments. Our operating segments reflect how our chief operating decision makers, which we define as a collective group of senior executives, assesses the performance of each operating segment and determines the appropriate allocations of resources to each segment. We continually review our operating segment classifications to align with operational changes in our business and may make changes as necessary.
We measure and evaluate our operating segments based on operating income and operating expenses that do not include allocations of costs related to corporate functions, such as accounting and finance, human resources, legal, tax and treasury, which are reported as unallocated corporate expenses in our consolidated statements of operations included in this annual report on Form 10-K. We also exclude costs such as amortization, depreciation, taxes and interest expense.
During the third quarter of 2016, we reclassed Salem Consumer Products, our e-commerce business that sells books, DVD’s and editorial content developed by our on-air personalities, from our Digital Media segment to our Broadcast segment. This reclassification was to consolidate all revenue and expenses generated by on-air hosts, which includes broadcast programs and e-commerce product sales to better assess the financial performance of each network program. This reclassification did not impact the reporting units used to test non-amortizable assets for impairment. All prior periods presented are updated to reflect this new composition of our operating segments. Refer to Note 20 – Segment Data in the notes to our Consolidated Financial Statements.
| 104 |
Variable Interest Entities
We may enter into agreements or investments with other entities that could qualify as variable interest entities (“VIEs”) in accordance with Financial Accounting Standards Board (“FASB”) Accounting Standards Codification (“ASC”) Topic 810 Consolidation. A VIE is consolidated in the financial statements if we are deemed to be the primary beneficiary. The primary beneficiary is the entity that holds the majority of the beneficial interests in the VIE, either explicitly or implicitly. A VIE is an entity for which the primary beneficiary’s interest in the entity can change with variations in factors other than the amount of investment in the entity. We perform our evaluation for VIE’s upon entry into the agreement or investment. We re-evaluate the VIE when or if events occur that could change the status of the VIE.
We may enter into lease arrangements with entities controlled by our principal stockholders or other related parties. We believe that the requirements of FASB ASC Topic 810 do not apply to these entities because the lease arrangements do not contain explicit guarantees of the residual value of the real estate, do not contain purchase options or similar provisions and the leases are at terms that do not vary materially from leases that would have been available with unaffiliated parties. Additionally, we do not have an equity interest in the entities controlled by our principal stockholders or other related parties and we do not guarantee debt of the entities controlled by our principal stockholders or other related parties.
We also enter into Local Marketing Agreements (“LMAs”) or Time Brokerage Agreements (“TBAs”) contemporaneously with entering into an Asset Purchase Agreement (“APA”) to acquire or sell a radio station. Typically, both LMAs and TBAs are contractual agreements under which the station owner/licensee makes airtime available to a programmer/licensee in exchange for a fee and reimbursement of certain expenses. LMAs and TBAs are subject to compliance with the antitrust laws and the communications laws, including the requirement that the licensee must maintain independent control over the station and, in particular, its personnel, programming, and finances. The FCC has held that such agreements do not violate the communications laws as long as the licensee of the station receiving programming from another station maintains ultimate responsibility for, and control over, station operations and otherwise ensures compliance with the communications laws.
The requirements of FASB ASC Topic 810 may apply to entities under LMAs or TBAs, depending on the facts and circumstances related to each transaction. As of December 31, 2017, we did not have implicit or explicit arrangements that required consolidation under the guidance in FASB ASC Topic 810.
Concentrations of Business Risks
We derive a substantial part of our total revenues from the sale of advertising. For the years ended December 31, 2017, 2016 and 2015, 36.8%, 38.3% and 39.2% of our total broadcast revenues, respectively, were generated from the sale of broadcast advertising. We are particularly dependent on revenue from stations in the Los Angeles and Dallas markets, which generated 15.4% and 19.3% for the year ended December 31, 2017, 15.1% and 20.8% for the year ended December 31, 2016 and 14.7% and 24.5% for the year ended December 31, 2015. Because substantial portions of our revenues are derived from local advertisers in these key markets, our ability to generate revenues in those markets could be adversely affected by local or regional economic downturns.
Concentrations of Credit Risks
Financial instruments that potentially subject us to concentrations of credit risk consist of cash and cash equivalents; trade accounts receivable and derivative instruments. We place our cash and cash equivalents with high quality financial institutions. Such balances may be in excess of the Federal Deposit Insurance Corporation insured limits. To manage the related credit exposure, we continually monitor the credit worthiness of the financial institutions where we have deposits. Concentrations of credit risk with respect to trade accounts receivable are limited due to the wide variety of customers and markets in which we provide services, as well as the dispersion of our operations across many geographic areas. We perform ongoing credit evaluations of our customers, but generally do not require collateral to support customer receivables. We establish an allowance for doubtful accounts based on various factors including the credit risk of specific customers, age of receivables outstanding, historical trends, economic conditions and other information. Historically, our bad debt expense has been within management’s expectations.
Use of Estimates
The preparation of financial statements in conformity with GAAP requires management to make estimates and assumptions that affect the amounts reported in the financial statements and accompanying notes. Actual results could differ from those estimates.
Significant areas for which management uses estimates include:
| · | asset impairments, including goodwill, broadcasting licenses, other indefinite-lived intangible assets, and assets held for sale; |
| · | probabilities associated with the potential for contingent earn-out consideration; |
| · | fair value measurements; |
| 105 |
| · | contingency reserves; |
| · | allowance for doubtful accounts; |
| · | sales returns and allowances; |
| · | barter transactions; |
| · | inventory reserves; |
| · | reserves for royalty advances; |
| · | fair value of equity awards; |
| · | self-insurance reserves; |
| · | estimated lives for tangible and intangible assets; |
| · | income tax valuation allowances; and |
| · | uncertain tax positions. |
These estimates require the use of judgment as future events and the effect of these events cannot be predicted with certainty. The estimates will change as new events occur, as more experience is acquired and as more information is obtained. We evaluate and update our assumptions and estimates on an ongoing basis and we may consult outside experts to assist as considered necessary.
Reclassifications
Certain reclassifications have been made to the prior year financial statements to conform to the current year presentation. These include the reclassification of land held for sale from current assets to long-term assets based on the APA term that exceeds twelve months.
Out-of-Period Adjustment
During the third quarter of 2016, we identified an error in our valuation allowance for certain deferred tax assets. We recorded an adjustment to increase our estimated deferred tax valuation allowance by $1.6 million for a portion of the deferred tax assets related to state net operating loss carryforwards that we determined were not more likely than not to be realized.
In evaluating the adjustment, we referred to the SEC Staff Accounting Bulletin (SAB) No. 99, including SAB Topic 1.M, which provides guidance on the assessment of materiality and states that “the omission or misstatement of an item in a financial report is material if, in the light of surrounding circumstances, the magnitude of the item is such that it is probable that the judgment of a reasonable person relying upon the report would have been changed or influenced by the inclusion or correction of the item.” We also referred to SAB 108 for guidance on considering the effects of prior year misstatements when quantifying misstatements in current year financial statements and the assessment of materiality.
Our analysis of the materiality of the adjustment was performed by reviewing quantitative and qualitative factors. We determined based on this analysis that the adjustment was not material to the current period and any prior periods.
Revision of Prior Period Consolidated Financial Statements
We identified an adjustment related to the accounting for deferred taxes associated with non-qualified stock options that were voluntarily surrendered or forfeited. These forfeitures should have been adjusted to the deferred tax assets with a corresponding entry to Additional Paid In Capital (“APIC”) or retained earnings if there was not a sufficient amount of excess tax benefits within APIC (“pool”) to absorb.
The impact primarily resulted from a voluntary surrender of 1,741,854 options in the third quarter of 2008 that most senior executives voluntarily participated in. The voluntary surrender was not accompanied by a concurrent grant of (or offer to grant) a replacement award or other valuable consideration. The voluntary surrender was accounted for as a repurchase for no consideration. The deferred tax asset associated with these options should have offset the APIC pool to the extent available, with the excess recorded as deferred tax expense.
In order to assess materiality with respect to the adjustments, we considered SAB 99, Materiality and SAB 108, Considering the Effects of Prior Year Misstatements when Quantifying Misstatements in Current Year Financial Statements, and determined that the impact of the adjustments on prior period consolidated financial statements was immaterial.
The impact of the adjustments on the Consolidated Financial Statements for each of the years presented is as follows:
| December 31, 2014 | ||||||||||||
| As Reported | Adjustment | As Revised | ||||||||||
| (in thousands) | ||||||||||||
| Additional Paid In Capital | $ | 240,493 | $ | (1,079 | ) | $ | 239,414 | |||||
| Retained Earnings (Accumulated Deficit) | (2,770 | ) | (1,447 | ) | (4,217 | ) | ||||||
| Total Stockholders' Equity | 203,994 | (2,526 | ) | 201,468 | ||||||||
| 106 |
| December 31, 2015 | ||||||||||||
| As Reported | Adjustment | As Revised | ||||||||||
| (in thousands) | ||||||||||||
| Additional Paid In Capital | 241,780 | (1,153 | ) | 240,627 | ||||||||
| Retained Earnings (Accumulated Deficit) | 1,768 | (1,447 | ) | 321 | ||||||||
| Total Stockholders' Equity | 209,821 | (2,600 | ) | 207,221 | ||||||||
| December 31, 2016 | ||||||||||||
| As Reported | Adjustment | As Revised | ||||||||||
| (in thousands) | ||||||||||||
| Deferred Income Tax Liability | $ | 60,769 | $ | 2,654 | $ | 63,423 | ||||||
| Total Liabilities | 376,422 | 2,654 | 379,076 | |||||||||
| Additional Paid In Capital | 243,607 | (1,207 | ) | 242,400 | ||||||||
| Retained Earnings (Accumulated Deficit) | 3,963 | (1,447 | ) | 2,516 | ||||||||
| Total Stockholders' Equity | 213,846 | (2,654 | ) | 211,192 | ||||||||
In considering if we should amend previously filed 2016 Form 10-K and 2017 Form 10-Q’s, our evaluation of SAB 99 considered that the aggregate impact of the adjustment did not impact our net income or loss before income taxes, was not material to our operating results, had no impact on operating cash flows, and had an insignificant impact on the Consolidated Balance Sheets. In aggregate, we do not believe it is probable that the views of a reasonable investor would have changed by this adjustment in each of the consolidated financial statements to warrant an amendment. Accordingly, the adjustment was made to the December 31, 2016 Consolidated Balance Sheet and the December 31, 2014 balances in the Consolidated Statement of Changes in Stockholders’ Equity as described above using the SAB 108 approach. The cumulative adjustment was recorded as a decrease of $2.7 million in deferred tax assets, which is presented as an increase in deferred tax liabilities, with a corresponding decrease in APIC of $1.2 million and a decrease in retained earnings of $1.5 million.
Recent Accounting Pronouncements
Changes to accounting principles are established by the FASB in the form of Accounting Standards Updates (“ASU”) to the FASB’s Codification. We consider the applicability and impact of all ASUs on our financial position, results of operations, cash flows, or presentation thereof. Described below are ASUs that are not yet effective, but may be applicable to our financial position, results of operations, cash flows, or presentation thereof. ASUs not listed below were assessed and determined to not be applicable to our financial position, results of operations, cash flows, or presentation thereof.
In February 2018, the FASB issued ASU 2018-03, Technical Corrections and Improvements to Financial Instruments-Overall (Subtopic 825-10). The amendments in ASU 2018-03 expand the strategies that qualify for hedge accounting and simplify the application of hedge accounting in certain situations. The standard is effective for fiscal years beginning after December 15, 2017, and interim periods within those fiscal years beginning after June 15, 2018. We do not expect the adoption of this accounting standard to have a material impact on our financial position, results of operations, cash flows, or presentation thereof.
In February 2018, the FASB issued ASU 2018-02, Income Statement - Reporting Comprehensive Income (Topic 220) – Reclassification of Certain Tax Effects from Accumulated Other Comprehensive Income. ASU 2018-02 allows a reclassification from accumulated other comprehensive income to retained earnings for stranded tax effects resulting from the Tax Cuts and Jobs Act of 2017 (“The Act”). Consequently, the amendments eliminate the stranded tax effects resulting from the Act to improve the usefulness of information reported to financial statement users. However, because the amendments only relate to the reclassification of the income tax effects of the Act, the underlying guidance that requires that the effect of a change in tax laws or rates be included in income from continuing operations is not affected. The standard is effective for fiscal years beginning after December 15, 2018, including interim periods within those fiscal years. The standard allows for early adoption, but we have not yet made that determination. We do not expect that the adoption of this standard will have a material impact on our financial statements.
In January 2018, the FASB issued ASU 2018-01, Leases (Topic 842) Land Easement Practical Expedient for Transition to Topic 842. ASU 2018-01 provides an optional transition practical expedient to not evaluate under Topic 842 existing or expired land easements that were not previously accounted for as leases under the current leases guidance in Topic 840. ASU 2018-01 is effective with ASU 2016-02 for fiscal years beginning after December 15, 2018, and interim periods within those fiscal years, with early adoption permitted. . We do not expect that the adoption of this standard will have a material impact on our financial statements.
In December 2017, the Securities and Exchange Commission (“SEC”) issued guidance under Staff Accounting Bulletin No. 118, Income Tax Accounting Implications of the Tax Cuts and Jobs Act (“SAB 118”) directing taxpayers to consider the impact of the U.S. legislation as “provisional” when it does not have the necessary information available, prepared or analyzed (including computations) in reasonable detail to complete its accounting for the change in tax law. As of December 31, 2017, we have not yet completed accounting for all of the tax effects of the enactment of the Act; however, we have made reasonable estimates of the effects on our existing deferred tax balances and one-time transition tax.
| 107 |
In November 2017, the FASB issued ASU 2017-14, Income Statement – Reporting Comprehensive Income (Topic 220), Revenue Recognition (Topic 605), and Revenue from Contracts with Customers (Topic 606). ASU 2017-14 supersedes various SEC paragraphs and amends an SEC paragraph pursuant to the issuance of Staff Accounting Bulletin No. 116. We do not expect these updates to have a material impact on our financial position, results of operations, cash flows, or presentation thereof.
In September 2017, the FASB issued ASU 2017-13, Revenue Recognition (Topic 605), Revenue from Contracts with Customers (Topic 606), Leases (Topic 840), and Leases (Topic 842). ASU 2017-13 provides additional clarification including the additional of SEC paragraphs to the new revenue and leases sections of the Codification. We do not expect these clarifications to have a material impact on our financial position, results of operations, cash flows, or presentation thereof.
In August 2017, the FASB issued ASU 2017-12, Derivatives and Hedging: Targeted Improvements to Accounting for Hedging Activities, which improves the financial reporting of hedging relationships to better align risk management activities in financial statements and make certain targeted improvements to simplify the application of the hedge accounting guidance in current GAAP. The standard is effective for fiscal years beginning after December 15, 2018, including interim periods within those fiscal years. Early adoption is permitted for any interim and annual financial statements that have not yet been issued. We do not expect the adoption of this accounting standard to have a material impact on our financial position, results of operations, cash flows, or presentation thereof.
In May 2017, the FASB issued ASU 2017-09, Compensation – Stock Compensation (Topic 718) Scope of Modification Accounting, which clarifies when to account for a change in the terms or conditions of a share-based payment award as a modification. ASU 2017-09 requires modification accounting only if the fair value, the vesting conditions, or the classification of the award (as equity or liability) changes as a result of the change in terms or conditions. ASU 2017-09 is effective for fiscal years beginning after December 15, 2017, and interim periods within those fiscal years. We do not expect the adoption of this accounting standard to have a material impact on our financial position, results of operations, cash flows, or presentation thereof.
In March 2017, the FASB issued ASU 2017-08, Receivables – Nonrefundable Fees and Other Costs (Subtopic 310-20), Premium on Purchased Callable Debt Securities, which amends the amortization period for certain purchased callable debt securities held at a premium to a shorter period based on the earliest call date. ASU 2017-08 is effective for fiscal years beginning after December 15, 2018, and interim periods within those fiscal years. We do not expect the adoption of this accounting standard to have a material impact on our financial position, results of operations, cash flows, or presentation thereof.
In February 2017, the FASB issued ASU 2017-05, Other Income – Gains and Losses from the Derecognition of Nonfinancial Assets (Topic 610-20), which clarifies the scope and application of ASC Topic 610-20 on accounting for the sale or transfer of nonfinancial assets, that is an asset with physical value such as real estate, equipment, intangibles or similar property. ASU 2017-05 is effective for fiscal years beginning after December 15, 2017, and interim periods within those fiscal years. We do not expect the adoption of this accounting standard to have a material impact on our financial position, results of operations, cash flows, or presentation thereof.
In January 2017, the FASB issued ASU 2017-01, Business Combinations – Clarifying the Definition of a Business, which clarifies the definition of a business for determining whether transactions should be accounted for as acquisitions or disposals of assets or businesses. ASU 2017-01 is effective for fiscal years beginning after December 15, 2018, and interim periods within those fiscal years, with early adoption permitted. We do not expect the adoption of ASU 2017-01 to have a material impact on our financial position, results of operations, cash flows, or presentation thereof.
| 108 |
In November 2016, the FASB issued ASU 2016-18, Statements of Cash Flows (Topic 230): Restricted Cash, which provides guidance on the presentation of restricted cash or restricted cash equivalents in the statement of cash flows. ASU 2016-18 is effective for fiscal years beginning after December 15, 2017, and interim periods within those fiscal years. We do not expect the adoption of ASU 2016-18 to have a material impact on our cash flows or presentation thereof.
In October 2016, the FASB issued ASU 2016-16 Intra-Entity Transfers of Assets Other Than Inventory” which modifies existing guidance for the accounting for income tax consequences of intra-entity transfers of assets. This ASU requires entities to immediately recognize the tax consequences on intercompany asset transfers (excluding inventory) at the transaction date, rather than deferring the tax consequences under current GAAP. The guidance is effective for fiscal years beginning after December 15, 2018, and interim reports within those fiscal years, with early adoption permitted only as of the first quarter of a fiscal year. We do not expect the adoption of ASU 2016-16 to have a material impact on our financial position, results of operations, cash flows, or presentation thereof.
In August 2016, the FASB issued ASU 2016-15, Statement of Cash Flows (Topic 230): Classification of Certain Cash Receipts and Cash Payments, which clarifies how entities should classify certain cash receipts and cash payments on the statement of cash flows with the objective of reducing diversity in practice related to eight specific types of transactions. The guidance is effective for fiscal years beginning after December 15, 2017, and interim periods within those fiscal years, with early adoption permitted. We do not expect the adoption of ASU 2016-15 to have a material impact on our financial cash flows or presentation thereof.
In June 2016, the FASB issued ASU 2016-13, Financial Instruments-Credit Losses, which changes the impairment model for most financial assets and certain other instruments. For trade and other receivables, held-to-maturity debt securities, loans and other instruments, entities will be required to use a new forward-looking “expected loss” model that will replace today’s “incurred loss” model and generally will result in the earlier recognition of allowances for losses. For available-for-sale debt securities with unrealized losses, entities will measure credit losses in a manner similar to current practice, except that the losses will be recognized as an allowance. The guidance is effective for fiscal years beginning after December 15, 2019, and interim periods within those fiscal years, with early adoption permitted. We have not yet evaluated the impact of the adoption of this accounting standard on our financial position, results of operations, cash flows, or presentation thereof.
In February 2016, the FASB issued ASU 2016-02, Leases (Topic 842), which requires that lessees recognize a right-of-use asset and a lease liability for all leases with lease terms greater than twelve months in the balance sheet. ASU 2016-02 requires additional disclosures including the significant judgments made by management to provide insight into the revenue and expense to be recognized from existing contracts and the timing and uncertainty of cash flows arising from leases. The guidance is effective for fiscal years beginning after December 15, 2018, and interim periods within those fiscal years, with early adoption permitted. We have not yet determined the dollar impact of recording operating leases on our statement of financial position. The adoption of ASU 2016-02 will have a material impact on our financial position and the presentation thereof. Our existing credit facility stipulates that our covenants are based on GAAP as of the agreement date. Therefore, the material impact of recording right-to-use assets and lease liabilities on our statement of financial position is not expected to impact the compliance status for any covenant.
In January 2016, the FASB issued ASU 2016-01, Recognition and Measurement of Financial Assets and Financial Liabilities, which provides updated guidance that enhances the reporting model for financial instruments, including amendments, to address aspects of recognition, measurement, presentation and disclosure. The guidance is effective for fiscal years beginning after December 15, 2017, and interim periods within those fiscal years. With the exception of the early application guidance applicable to certain entities, early adoption of the amendments is not permitted. We do not expect the adoption of this accounting standard to have a material impact on our financial position, results of operations, cash flows, or presentation thereof.
In May 2014, the FASB issued ASU 2014-09, Revenue from Contracts with Customers (Topic 606) and issued subsequent amendments to the initial guidance in August 2015, March 2016, April 2016, May 2016, December 2016, and September 2017 within ASU 2015-14, ASU 2016-08, ASU 2016-10, ASU 2016-12, and ASU 2016-20 respectively (ASU 2014-09, ASU 2015-14, ASU 2016-08, ASU 2016-10, ASU 2016-12, ASU 2016-20 and ASU 2017-13 collectively, “Topic 606”). Topic 606 supersedes nearly all existing revenue recognition guidance under GAAP. The core principle of Topic 606 is to recognize revenues when promised goods or services are transferred to customers in an amount that reflects the consideration that is expected to be received for those goods or services. Topic 606 defines a five-step process to achieve this core principle and, in doing so, it is possible more judgment and estimates may be required within the revenue recognition process than are required under existing GAAP. These estimates include identifying performance obligations in the contract, estimating the amount of variable consideration to include in the transaction price and allocating the transaction price to each separate performance obligation, among others. We adopted the new guidance on January 1, 2018, using the modified retrospective method. Under this method, the effect of any change resulting from the new guidance will be recognized in retained earnings as of the date of initial application; prior periods will not be restated. Based on further progress with our ASC 606 implementation plan, we do not expect the new guidance to have a material impact on our financial position, results of operations, cash flows, or presentation thereof. However, additional disclosures will be included in future reporting periods in accordance with requirements of the new guidance.
| 109 |
NOTE 2. IMPAIRMENT OF GOODWILL AND OTHER INDEFINITE-LIVED INTANGIBLE ASSETS
We account for goodwill and other indefinite-lived intangible assets in accordance with FASB ASC Topic 350 Intangibles—Goodwill and Other that requires that we test for impairment at least annually or when events or circumstances indicates that they may be impaired. Approximately 71% of our total assets at December 31, 2017 consisted of indefinite-lived intangible assets including broadcast licenses, goodwill and mastheads. We do not amortize broadcast licenses, goodwill and mastheads but rather test for impairment annually or more frequently if events or circumstances indicate that the value may be impaired. We perform our annual impairment testing during the fourth quarter of each year, which coincides with our budget and planning process for the upcoming year.
Broadcast Licenses
We perform a qualitative assessment for each of our broadcast market clusters annually. We review the significant assumptions and key estimates applicable to our prior year estimated fair value calculations to assess if events and circumstances have occurred that could affect these assumptions and key estimates. We also review internal benchmarks and the economic performance for each market cluster to assess if it is more likely than not that impairment exists.
The first step of our qualitative assessment is to calculate excess fair value, or the amount by which our prior year estimated fair value exceeds the current year carrying value. We believe based on our analysis and review, including the financial performance of each market, that a 25% excess fair value margin is a conservative and reasonable benchmark for our qualitative analysis. Markets with an excess fair value of 25% or more, which have had no significant changes in the prior year assumptions and key estimates, are not likely to be impaired.
Of the 25 markets for which an independent third party fair value appraisal was obtained in the prior year, eight markets were subject to testing in the current year. The table below presents the percentage within a range by which our prior year start-up income estimated fair value exceeds the current year carrying value of our broadcasting licenses:
| Geographic Market Clusters as of December 31, 2017 | ||||||||||||||||
| Percentage Range By Which 2016 Estimated Fair Value Exceeded 2017 Carrying Value | ||||||||||||||||
| ≤ 25% | >26%-50% | >50% to 75% | > than 75% | |||||||||||||
| Number of accounting units | 8 | 2 | - | 15 | ||||||||||||
| Broadcast license carrying value (in thousands) | $ | 174,287 | $ | 7,692 | $ | - | $ | 105,641 | ||||||||
The second step of our qualitative assessment consists of a review of the financial operating results for each market cluster. Radio stations are often sold on the basis of a multiple of projected cash flow, or Station Operating Income (“SOI”) defined as net broadcast revenue less broadcast operating expenses. See Item 6 – Selected Financial Data within this annual report for information on SOI, a non-GAAP measure. Numerous trade organizations and analysts review these radio station sales to track SOI multiples applicable to each transaction. Based on published reports and analysis of market transactions, we believe industry benchmarks to be in the six to seven times cash flow range. We elected an SOI benchmark of four as a conservative indicator of fair value. Based on this qualitative review, we identified eight additional markets subject to further testing, which included each of the eight markets not tested in the prior year. We identified one additional market subject to further testing based on declining SOI margins.
The table below shows the percentage within a range by which our estimated fair value exceeded the carrying value of our broadcasting licenses for these nine market clusters:
| Geographic Market Clusters as of December 31, 2017 | ||||||||||||||||
| Tested due to SOI Multiple and length of time from prior valuation – Percentage Range by Which Prior Valuation Exceeded 2017 Carrying Value | ||||||||||||||||
| ≤ 25% | >26%-50% | >50% to 100% | > than 100% | |||||||||||||
| Number of accounting units | - | 4 | 1 | 4 | ||||||||||||
| Broadcast license carrying value (in thousands) | $ | - | $ | 49,765 | $ | 27,878 | $ | 27,372 | ||||||||
Based on our qualitative assessment we engaged Noble Financial, an independent third-party appraisal and valuation firm, to assist us with determining the enterprise value as part of our quantitative review. The quantitative review performed was to estimate the fair value of broadcast licenses in 17 of our market clusters. The estimated fair value of each market cluster was determined using the Greenfield Method, a form of the income approach. The premise of the Greenfield Method is that the value of an FCC license is equivalent to a hypothetical start-up in which the only asset owned by the station as of the valuation date is the FCC license. This approach eliminates factors that are unique to the operation of the station, including its format and historical financial performance. The method then assumes the entity has to purchase, build, or rent all of the other assets needed to operate a comparable station to the one in which the FCC license is being utilized as of the valuation date. Cash flows are estimated and netted against all start-up costs, expenses and investments necessary to achieve a normalized and mature state of operations, thus reflecting only the cash flows directly attributable to the FCC License. A multi-year discounted cash flow approach is then used to determine the net present value of these cash flows to derive an indication of fair value. For cash flows beyond the projection period, a terminal value is calculated using the Gordon constant growth model and long-term industry growth rate assumptions based on long-term industry growth and Gross Domestic Product (“GDP”) inflation rates.
| 110 |
The primary assumptions used in the Greenfield Method are:
| (1) | gross operating revenue in the station’s designated market area, |
| (2) | normalized market share, |
| (3) | normalized profit margin, |
| (4) | duration of the “ramp-up” period to reach normalized operations, (which was assumed to be three years), |
| (5) | estimated start-up costs (based on market size), |
| (6) | ongoing replacement costs of fixed assets and working capital, |
| (7) | the calculations of yearly net free cash flows to invested capital; and |
| (8) | amortization of the intangible asset, the FCC license. |
The assumptions used reflect those of a hypothetical market participant and not necessarily the actual or projected results of Salem. The key estimates and assumptions used in the start-up income valuation for our broadcast licenses were as follows:
| Broadcast Licenses | December 31, 2015 | December 31, 2016 | December 31, 2017 | |||
| Risk-adjusted discount rate | 8.0% | 8.5% | 9.0% | |||
| Operating profit margin ranges | (13.9)% - 30.8% | (13.9)% - 30.8% | (13.9)% - 30.8% | |||
| Long-term market revenue growth rate ranges | 2.0% | 1.9% | 1.9% |
The risk-adjusted discount rate reflects the Weighted Average Cost of Capital (“WACC”) developed based on data from same or similar industry participants and publicly available market data as of the measurement date. The increase in the WACC for the 2017 testing period as compared to 2016 was largely attributable to increases in corporate borrowing interest rates during 2017 within the composite mix of industry participants considered in the analysis and the impact of the tax reform act of 2017.
Based on our review and analysis, we did not recognize impairment charges to our broadcast license as of the annual testing period ended December 31, 2017. The table below presents the results of our impairment testing under the income approach for the 2017 annual testing period.
| Market Cluster | Excess Fair Value 2017 Estimate | |||
| Atlanta, GA | 3.5 | % | ||
| Boston, MA | 31.6 | % | ||
| Chicago, IL | 63.0 | % | ||
| Cleveland, OH | 4.4 | % | ||
| Col Springs, CO | 89.9 | % | ||
| Dallas, TX | 1.3 | % | ||
| Detroit, MI | 5.3 | % | ||
| Greenville, SC | 92.0 | % | ||
| Louisville, KY | 22.3 | % | ||
| Miami FL | 71.3 | % | ||
| Minneapolis, MN | 68.2 | % | ||
| Omaha NE | 27.3 | % | ||
| Orlando FL | 55.5 | % | ||
| Portland, OR | 3.3 | % | ||
| Sacramento, CA | 15.9 | % | ||
| San Francisco, CA | 3.1 | % | ||
| Tampa, FL | 22.9 | % | ||
Mastheads
We regularly perform quantitative reviews of mastheads due to the low margins by which the estimated fair value has exceeded our carrying value. Due to operating results that did not meet management’s expectations, we ceased publishing Preaching Magazine™, YouthWorker Journal™, FaithTalk Magazine™ and Homecoming™. The Magazine upon issuance of the May 2017 publication. Because of the likelihood that these print magazines would be sold or otherwise disposed of before the end of their previously estimated life, we performed impairment tests as of March 31, 2017. Due to reductions in forecasted operating cash flows and indications of interest from potential buyers, we then recorded an impairment charge of $19,000 associated with mastheads. For the annual testing period ended December 31, 2017, we engaged Noble Financial, an independent third-party appraisal firm, to assist us in estimating the fair value of our mastheads using a Relief from Royalty method, a form of the income approach.
| 111 |
The Relief from Royalty method estimates the fair value of mastheads through use of a discounted cash flow model that incorporates a hypothetical “royalty rate” that a third-party owner would be willing to pay in lieu of owning the asset. The royalty rate is based on observed royalty rates for comparable assets as of the measurement date. We adjust the selected royalty rate to account for a percentage of the royalty fee that could be attributed to the use of other intangibles, such as goodwill, time in existence, trade secrets and industry expertise. The adjusted royalty rate represents the royalty fee remaining that could be attributed to the use of the masthead only.
Pre-tax royalty income is based on a 10-year revenue forecast and assumed to carry on into perpetuity. Revenue beyond the projection period (terminal year) is based on estimated long-term industry growth rates. The analysis also incorporated the present value of the tax amortization benefit associated with the mastheads. The key estimates and assumptions are as follows:
| Mastheads | December 31, 2015 | December 31, 2016 | December 31, 2017 | |||
| Risk-adjusted discount rate | 8.0% | 9.5% | 10.0% | |||
| Projected revenue growth ranges | 2.1% – 2.9% | (4.3)% – 1.2% | (3.2)% – 0.9% | |||
| Royalty rate | 3.0% | 3.0% | 3.0% |
The risk-adjusted discount rate reflects the WACC developed based on data from same or similar industry participants and publicly available market data as of the measurement date. The increase in the WACC for the 2017 testing period as compared to 2016 was largely attributable to increases in corporate borrowing interest rates during 2016 within the composite mix of industry participants considered in the analysis and the impact of the tax reform act of 2017.
Based on our review and analysis, we did not recognize impairment charges to mastheads as of the annual testing period ended December 31, 2017.
Goodwill – Broadcast Radio Stations
Nineteen of our broadcast markets had goodwill associated with them as of December 31, 2017. Based on our qualitative review, we tested three of these market clusters for impairment of goodwill. We engaged Noble Financial, an independent third-party appraisal firm, to assist us in estimating the enterprise of value our market clusters for the purpose of testing goodwill for impairment.
The key estimates and assumptions used for our enterprise valuations are as follows:
| Broadcast Markets Enterprise Valuations | December 31, 2015 | December 31, 2016 | December 31, 2017 | |||
| Risk-adjusted discount rate | 8.0% | 8.5% | 9.0% | |||
| Operating profit margin ranges | 49.7% | (18.5)% – 43.3% | (7.8)% – 36.2% | |||
| Long-term revenue market growth rate ranges | 2.0% | 1.9% | 1.9% |
The risk-adjusted discount rate reflects the WACC developed based on data from same or similar industry participants and publicly available market data as of the measurement date. The increase in the WACC for the 2017 testing period as compared to 2016 was largely attributable to increases in corporate borrowing interest rates during 2017 within the composite mix of industry participants considered in the analysis and the impact of the tax reform act of 2017.
Based on our review and analysis, we determined that no impairment charges were necessary to the carrying value of our broadcast market goodwill as of the annual testing period ended December 31, 2017.
The tables below present the percentage within a range by which the estimated fair value exceeded the carrying value of each of our market clusters, including goodwill:
| Broadcast Market Clusters as of December 31, 2017 | ||||||||||||||||
| Percentage Range By Which Estimated Fair Value Exceeds Carrying Value Including Goodwill | ||||||||||||||||
| < 10% | >10% to 20% | >20% to 50% | > than 50% | |||||||||||||
| Number of accounting units | 3 | 2 | 7 | 7 | ||||||||||||
| Carrying value including goodwill (in thousands) | 83,729 | $ | 25,053 | $ | 120,849 | $ | 69,981 | |||||||||
Goodwill – Broadcast Networks
TCM, one of our five networks has goodwill associated with it as of our annual testing period ended December 31, 2017. Based on the first step of our qualitative review, in which we calculate excess fair value, or the amount by which our prior year estimated fair value exceeds the current year carrying value, with no significant changes in the prior year assumptions and key estimates, the value of broadcast network goodwill is not likely to be impaired
Based on this review and analysis, we determined that the fair value of the reporting unit was more than the carrying value. No impairment charges were recorded and Step 2 was not necessary based on the results. We did not perform a sensitivity analysis for the current year certain key assumptions, as such changes in assumptions would have no impact on the carrying value of goodwill associated with our broadcast networks.
| 112 |
Goodwill – Digital Media
Four of our digital media businesses had goodwill associated with them as of our annual testing period ended December 31, 2017. We tested two of these entities for impairment based on our qualitative review indicating an excess carrying value of less than 25%. The key estimates and assumptions used in the valuation of our digital media entities for each testing period are as follows:
| Digital Media Enterprise Valuations | December 31, 2015 | December 31, 2016 | December 31, 2017 | |||
| Risk adjusted discount rate | 8.0% - 9.0% | 8.5% - 9.5% | 10.0% | |||
| Operating profit margin ranges | (8.9)% - 13.8% | (20.3)% - 8.2% | 8.0% – 36.0% | |||
| Long-term revenue market growth rate ranges | 2.0 - 3.0% | 1.9% - 2.5% | 1.9% - 2.0% |
The risk-adjusted discount rate reflects the WACC developed based on data from same or similar industry participants and publicly available market data as of the measurement date. The increase in the WACC for the 2017 testing period as compared to 2016 was largely attributable to increases in the risk free rate and corporate borrowing interest rates during 2017 as compared to the prior year and the impact of the tax reform act of 2017.
We engaged Noble Financial, an independent third-party appraisal firm, to assist us in estimating the enterprise of value this entity for the purpose of testing goodwill for impairment. Based on this review and analysis, we determined that the fair value of the reporting unit was more than the carrying value. No impairment charges were recorded and Step 2 was not necessary based on the results. We did not perform a sensitivity analysis for the current year certain key assumptions, as such changes in assumptions would have no impact on the carrying value of goodwill associated with our digital media entities.
The table below presents the percentage within a range by which the estimated fair value exceeded the carrying value of our accounting units, including goodwill.
| Digital Media Entities as of December 31, 2017 | ||||||||||||||||
| Percentage Range By Which Estimated Fair Value Exceeds Carrying Value Including Goodwill | ||||||||||||||||
| < 10% | >10% to 20% | >20% to 50% | > than 50% | |||||||||||||
| Number of accounting units | 1 | - | 1 | 2 | ||||||||||||
| Carrying value including goodwill (in thousands) | $ | 448 | $ | - | $ | 3,585 | $ | 28,343 | ||||||||
Goodwill – Publishing
Two of our publishing entities had goodwill associated with them as of the annual testing period ended December 31, 2017. Based on actual operating results that did not meet our annual projections, we engaged Noble Financial, an independent third-party appraisal firm to assist us with estimating the enterprise value of one of these entities for the purpose of testing goodwill for impairment. The enterprise valuation assumes that the subject assets are installed as part of an operating business rather than as a hypothetical start-up. The key estimates and assumptions used for our enterprise valuations are as follows:
| Publishing Enterprise Valuations | December 31, 2015 | December 31, 2016 | December 31, 2017 | |||
| Risk adjusted discount rate | 8.0% | 8.5% | 10.0% | |||
| Operating margin ranges | 4.2% – 6.2% | 3.5% – 5.7% | 5.0% – 5.5% | |||
| Long-term revenue market growth rates | 2.0% | 1.9% | 1.9% |
The risk-adjusted discount rate reflects the WACC developed based on data from same or similar industry participants and publicly available market data as of the measurement date. The increase in the WACC for the 2017 testing period as compared to 2016 was largely attributable to increases in corporate borrowing interest rates during 2017 within the composite mix of industry participants considered in the analysis and the impact of the tax reform act of 2017.
Based on our review and analysis of the enterprise estimated fair value, we determined that no impairment charges were necessary to the carrying value of goodwill associated with our publishing entities as of the annual testing period ended December 31, 2017 and that Step 2 was not necessary.
The table below presents the percentage within a range by which the estimated fair value exceeded the carrying value of our accounting units, including goodwill.
| 113 |
| Publishing Entities as of December 31, 2017 | ||||||||||||||||
| Percentage Range By Which Estimated Fair Value Exceeds Carrying Value Including Goodwill | ||||||||||||||||
| < 10% | >10% to 20% | >20% to 50% | > than 50% | |||||||||||||
| Number of accounting units | - | - | - | 2 | ||||||||||||
| Carrying value including goodwill (in thousands) | $ | - | $ | - | $ | - | $ | 2,993 | ||||||||
We believe that we have made reasonable estimates and assumptions to calculate the estimated fair value of our indefinite-lived intangible assets, however, these estimates and assumptions are highly judgmental in nature. Actual results can be materially different from estimates and assumptions. If actual market conditions are less favorable than those projected by the industry or by us, or if events occur or circumstances change that would reduce the estimated fair value of our indefinite-lived intangible assets below the amounts reflected on our balance sheet, we may recognize future impairment charges, the amount of which may be material.
NOTE 3. IMPAIRMENT OF LONG-LIVED ASSETS
We account for property and equipment in accordance with FASB ASC Topic 360-10, Property, Plant and Equipment. We periodically review our long-lived assets for impairment whenever events or changes in circumstances indicate that the carrying amount of the assets may not be fully recoverable. Our review requires us to estimate the fair value of assets when events or circumstances indicate that they may be impaired. The fair value measurements for our long-lived assets use significant observable inputs that reflect our own assumptions about the estimates that market participants would use in measuring fair value including assumptions about risk. If actual future results are less favorable than the assumptions and estimates we used, we are subject to future impairment charges, the amount of which may be material. There were no indications of impairment during the year ended December 31, 2017.
NOTE 4. ACQUISITIONS AND RECENT TRANSACTIONS
During the year ended December 31, 2017, we completed or entered into the following transactions:
2017 Debt Transactions
On May 19, 2017, we closed on a private offering of $255.0 million aggregate principal amount of 6.75% senior secured notes due 2024 (the “Notes”) and concurrently entered into a five-year $30.0 million senior secured asset-based revolving credit facility, which includes a $5.0 million subfacility for standby letters of credit and a $7.5 million subfacility for swingline loans (“ABL Facility”) due May 19, 2022. The net proceeds from the offering of the Notes, together with borrowings under the ABL Facility, were used to repay outstanding borrowings, including accrued and unpaid interest, on our previously existing senior credit facilities consisting of a term loan (“Term Loan B”) and a revolving credit facility of $25.0 million (“Revolver”), and to pay fees and expenses incurred in connection with the Notes offering and the ABL Facility (collectively, the “Refinancing”).
In connection with the Refinancing, on May 19, 2017, we repaid $258.0 million in principal on the Term Loan B and paid interest due as of that date. We recorded a $0.6 million pre-tax loss on the early retirement of long-term debt related to the unamortized discount and a $1.5 million pre-tax loss on the early retirement of long-term debt related to unamortized debt issuance costs associated with the Term Loan B. We also terminated the Revolver as of May 19, 2017. We repaid $4.1 million in outstanding principal on the Revolver and paid interest due as of that date. We recorded a $56,000 pre-tax loss on the early retirement of long-term debt related to unamortized debt issuance costs associated with the Revolver.
On February 28, 2017, we repaid $3.0 million principal on the Term Loan B of $300.0 million, and paid interest due as of that date. We recorded a $6,200 pre-tax loss on the early retirement of long-term debt related to the unamortized discount and $18,000 in unamortized debt issuance costs associated with the principal repayment.
On January 30, 2017, we repaid $2.0 million in principal on the Term Loan B and paid interest due as of that date. We recorded a $4,500 pre-tax loss on the early retirement of long-term debt related to the unamortized discount and $12,000 in unamortized debt issuance costs associated with the principal repayment.
2017 Equity Transactions
On December 7, 2017, we announced a quarterly equity distribution in the amount of $0.0650 per share on Class A and Class B common stock. The equity distribution of $1.7 million was paid on December 29, 2017 to all Class A and Class B common stockholders of record as of December 18, 2017.
On September 12, 2017, we announced a quarterly equity distribution in the amount of $0.0650 per share on Class A and Class B common stock. The equity distribution of $1.7 million was paid on September 29, 2017 to all Class A and Class B common stockholders of record as of September 22, 2017.
On August 9, 2017, a restricted stock award of 33,066 shares was granted to an executive that vested immediately. The fair value of the restricted stock award was measured based on the grant date market price of our common shares and expensed as of the vesting date. The restricted stock award contained transfer restrictions under which they could not be sold, pledged, transferred or assigned until 90 days from the vesting date. The recipient of this restricted stock award is entitled to all of the rights of absolute ownership of the restricted stock from the date of grant, including the right to vote the shares and to receive dividends. Restricted stock awards are independent of option grants and are granted at no cost to the recipient other than applicable taxes owed by the recipient. The award was considered issued and outstanding from the vest date of grant.
| 114 |
On June 1, 2017, we announced a quarterly equity distribution in the amount of $0.0650 per share on Class A and Class B common stock. The equity distribution of $1.7 million was paid on June 30, 2017 to all Class A and Class B common stockholders of record as of June 16, 2017.
On March 9, 2017, we announced a quarterly equity distribution in the amount of $0.0650 per share on Class A and Class B common stock. The equity distribution of $1.7 million was paid on March 31, 2017 to all Class A and Class B common stockholders of record as of March 20, 2017.
On February 24, 2017, a restricted stock award of a total of 178,592 shares was granted to certain members of management that vested immediately. The fair value of each restricted stock award was measured based on the grant date market price of our common shares and expensed as of the vesting date. These restricted stock awards contained transfer restrictions under which they could not be sold, pledged, transferred or assigned until three months from the vesting date. Recipients of these restricted stock awards were entitled to all the rights of absolute ownership of the restricted stock from the date of grant, including the right to vote the shares and to receive dividends. Restricted stock awards are independent of option grants and are granted at no cost to the recipient other than applicable taxes owed by the recipient. The awards were considered issued and outstanding from the vest date of grant.
2017 Acquisitions – Broadcast
On November 22, 2017, we closed on the acquisition of radio station WSPZ-AM (now WWRC-AM) in Bethesda, Maryland for $0.6 million in cash from a related party. We began programming the station under an LMA within our Washington DC broadcast market on September 15, 2017. The accompanying Consolidated Statement of Operations reflects the operating results of this station as of the LMA date within our broadcast segment.
On September 15, 2017, we closed on the acquisition of real property, including the land, tower and broadcasting facilities, of radio station WSPZ-AM (now WWRC-AM) in Bethesda, Maryland for $1.5 million in cash. We recognized goodwill of approximately $13,000 associated with the going concern value of the existing income generating leases acquired with the broadcast tower.
On July 24, 2017, we closed on the acquisition of the FM translator construction permit in Eaglemount, Washington, for $40,000 in cash. The FM translator will be relocated to the Portland, Oregon market for use by our KDZR-AM radio station.
On June 28, 2017, we closed on the acquisition of an FM translator construction permit in Festus, Missouri for $40,000 in cash. The FM translator will be relocated to the St. Louis, Missouri market for use by our KXFN-FM radio station.
On March 14, 2017, we closed on the acquisition of an FM translator construction permit in Quartz Site, Arizona for $20,000 in cash. The FM translator will be relocated to the San Diego, California market for use by our KPRZ-AM radio station.
On March 1, 2017, we closed on the acquisition of an FM translator construction permit in Roseburg, Oregon for $45,000 in cash. The FM translator will be relocated to the Portland, Oregon market for use by our KPDQ-AM radio station.
On January 16, 2017, we closed on the acquisition of an FM translator in Astoria, Oregon for $33,000 in cash. The FM translator will be relocated to the Seattle, Washington market for use by our KGNW-AM radio station.
On January 6, 2017, we closed on the acquisition of an FM translator construction permit in Mohave Valley, Arizona for $20,000 in cash. The FM translator will be relocated to the San Diego, California market for use by our KCBQ-AM radio.
2017 Acquisitions − Digital Media
On August 31, 2017, we acquired the TeacherTube.com website and related assets for $1.1 million in cash. TeacherTube.com is an online instructional video sharing community for teachers, students and parents.
On August 31, 2017, we acquired the Intelligence Report newsletter and related assets valued at $2.5 million and we assumed deferred subscription liabilities of $2.9 million. We paid no cash to the seller upon closing.
On July 6, 2017, we acquired the TradersCrux.com website and related assets for $0.3 million in cash. As part of the purchase agreement, we may pay up to an additional $0.1 million in contingent earn-out consideration within one year upon the achievement of income benchmarks.
On June 8, 2017, we acquired a Portuguese Bible mobile application and related assets for $65,000 in cash. As part of the purchase agreement, we may pay up to an additional $20,000 in contingent earn-out consideration over the next twelve months based on the achievement of certain revenue benchmarks.
On March 15, 2017, we acquired the website prayers-for-special-help.com and related assets for $0.2 million in cash.
| 115 |
A summary of our business acquisitions and asset purchases during the year ended December 31, 2017, none of which were individually or in the aggregate material to our consolidated financial position as of the respective date of acquisition, is as follows:
| Acquisition Date | Description | Total Cost | ||||
| (Dollars in thousands) | ||||||
| November 22, 2017 | WWRC-AM (formerly WSPZ-AM) in Bethesda, Maryland (business acquisition) | $ | 620 | |||
| September 15, 2017 | Real property of radio station WSPZ-AM in Bethesda, Maryland (business acquisition) | 1,500 | ||||
| August 31, 2017 | TeacherTube.com (business acquisition) | 1,100 | ||||
| August 31, 2017 | Intelligence Reporter newsletter (business acquisition) | — | ||||
| July 24, 2017 | FM Translator construction permit, Eaglemount, Washington (asset acquisition) | 40 | ||||
| July 6, 2017 | TradersCrux.com (business acquisition) | 298 | ||||
| June 28, 2017 | FM Translator construction permit, Festus, Missouri (asset acquisition) | 40 | ||||
| June 8, 2017 | Portuguese Bible Mobile Applications (business acquisition) | 82 | ||||
| March 15, 2017 | Prayers for Special Help (business acquisition) | 245 | ||||
| March 14, 2017 | FM Translator construction permit, Quartz Site, Arizona (asset purchase) | 20 | ||||
| March 1, 2017 | FM Translator construction permit, Roseburg, Oregon (asset purchase) | 45 | ||||
| January 16, 2017 | FM Translator, Astoria, Oregon (asset purchase) | 33 | ||||
| January 1, 2017 | FM Translator construction permit, Mohave Valley, Arizona (asset purchase) | 20 | ||||
| $ | 4,043 | |||||
The operating results of our business acquisitions and asset purchases are included in our consolidated results of operations from their respective closing date or the date that we began operating them under an LMA or TBA. Under the acquisition method of accounting as specified in FASB ASC Topic 805, Business Combinations, the total acquisition consideration is allocated to the assets acquired and liabilities assumed based on their estimated fair values as of the date of the transaction.
Estimates of the fair value include discounted estimated cash flows to be generated by the assets and their expected useful lives based on historical experience, market trends and any synergies believed to be achieved from the acquisition. Acquisitions may include contingent consideration, the fair value of which is estimated as of the acquisition date as the present value of the expected contingent payments as determined using weighted probabilities of the payment amounts. We may retain a third-party appraiser to estimate the fair value of the acquired net assets as of the acquisition date. As part of the valuation and appraisal process, the third-party appraiser prepares a report assigning estimated fair values to the various assets acquired. These fair value estimates are subjective in nature and require careful consideration and judgment. Management reviews the third party reports for reasonableness of the assigned values.
We believe that these valuations and analysis provide appropriate estimates of the fair value for the net assets acquired as of the acquisition date. These initial valuations are subject to refinement during the measurement period, which may be up to one year from the acquisition date. During this measurement period, we may retroactively record adjustments to the net assets acquired based on additional information obtained for items that existed as of the acquisition date. Upon the conclusion of the measurement period, any adjustments are reflected in our Consolidated Statements of Operations. To date, we have not recorded adjustments to the estimated fair values used in our acquisition consideration during or after the measurement period.
Property and equipment are recorded at the estimated fair value and depreciated on a straight-line basis over their estimated useful lives. Finite-lived intangible assets are recorded at their estimated fair value and amortized on a straight-line basis over their estimated useful lives. Goodwill, which represents the organizational systems and procedures in place to ensure the effective operation of the entity, may also be recorded and tested for impairment. Costs associated with acquisitions, such as consulting and legal fees, are expensed as incurred. We recognized costs associated with acquisitions of $0.1 million during the year ended December 31, 2017 compared to $0.5 million during the prior year, which are included in unallocated corporate expenses in the accompanying Consolidated Statements of Operations.
The total acquisition consideration is equal to the sum of all cash payments, the fair value of any deferred payments and promissory notes, and the present value of any estimated contingent earn-out consideration. We estimate the fair value of contingent earn-out consideration using a probability-weighted discounted cash flow model. The fair value measurement is based on significant inputs that are not observable in the market and thus represent a Level 3 measurement as defined in Note 12 - Fair Value Measurements.
| 116 |
The following table summarizes the total acquisition consideration for the year ended December 31, 2017:
| Description | Total Consideration | |||
| (Dollars in thousands) | ||||
| Cash payments made upon closing | $ | 3,972 | ||
| Escrow deposits paid in prior years | 35 | |||
| Present value of estimated fair value of contingent earn-out consideration | 36 | |||
| Total purchase price consideration | $ | 4,043 | ||
The fair value of the net assets acquired was allocated as follows:
| Net Broadcast | Net Digital Media | Total Net | ||||||||||
| Assets Acquired | Assets Acquired | Assets Acquired | ||||||||||
| (Dollars in thousands) | ||||||||||||
| Assets | ||||||||||||
| Property and equipment | $ | 1,915 | $ | 479 | $ | 2,394 | ||||||
| Broadcast licenses | 389 | — | 389 | |||||||||
| Goodwill | 14 | 810 | 824 | |||||||||
| Customer lists and contracts | — | 314 | 314 | |||||||||
| Domain and brand names | — | 647 | 647 | |||||||||
| Subscriber base and lists | — | 2,316 | 2,316 | |||||||||
| Non-compete agreements | — | 11 | 11 | |||||||||
| $ | 2,318 | $ | 4,577 | $ | 6,895 | |||||||
| Liabilities | ||||||||||||
| Deferred revenue | $ | — | (2,852 | ) | (2,852 | ) | ||||||
| $ | 2,318 | $ | 1,725 | $ | 4,043 | |||||||
2017 Divestitures
On December 28, 2017, we sold real property, including the land, tower and broadcasting facilities, of radio station WSPZ-AM (now WWRC-AM) in Bethesda, Maryland for $1.9 million in cash. We recorded a pre-tax gain on the sale of approximately $0.4 million.
On June 1, 2017, we received $0.6 million in cash for a former transmitter site in our Dallas, Texas market that we had leased to a third party.
Due to operating results that did not meet management’s expectations, we ceased publishing Preaching Magazine™, YouthWorker Journal™, FaithTalk Magazine™ and Homecoming™. The Magazine upon delivery of the May 2017 print publications. On May 30, 2017, we received $10,000 for Preaching Magazine™ and YouthWorker Journal™. The purchaser assumed all deferred subscription liabilities for these publications resulting in a pre-tax gain on the sale or disposal of assets of approximately $56,000.
On January 3, 2017, Word Broadcasting began operating our Louisville radio stations (WFIA-AM; WFIA-FM; WGTK-AM) under a twenty-four month TBA. We received $0.5 million in cash associated with an option for Word Broadcasting Network to acquire the radio stations during the term.
Pending Transactions at December 31, 2017
On December 29, 2017, we entered into two Local Marketing Agreements (“LMA”) to program radio stations KPAM-AM and KKOV-AM in Portland, Oregon. We began operating the radio stations on January 2, 2018. The LMA’s have a 12-month term.
On December 1, 2017, we entered into an agreement to sell radio station WQVN-AM (formerly WKAT-AM in Miami, Florida for $3.5 million in cash. The buyer began operating the radio station under an LMA agreement as of the same date. The sale is expected to close during the first quarter of 2018. We recorded an estimated loss of $4.7 million as of December 31, 2017, based on the probability of the sale, which reflected the sales price as compared to the carrying value of the assets and the estimated costs of the sale.
In August 2017, we received an escrow deposit under an agreement to sell land in Covina, California for $1.0 million dollars. The land is recorded in long-term assets held for sale and has not been used in operations. The sale is subject to the buyer’s ability to complete due diligence on their expected use of the land and is currently expected to close in the latter half of 2020.
We are programming radio station KHTE-FM, Little Rock, Arkansas, under a 36 month TBA that began on April 1, 2015. The TBA is extendable for up to 48 months. We have the option to acquire the station for $1.2 million in cash during the TBA period. We are required to pay the licensee a $0.1 million fee if we do not exercise our option right to purchase the station.
During the year ended December 31, 2016, we completed or entered into the following transactions:
| 117 |
2016 Debt Transactions
On December 30, 2016, we paid $5.0 million in principal on our Term Loan B, and paid interest due as of that date. We recorded a $12,000 pre-tax loss on the early retirement of long-term debt related to the unamortized discount and $33,000 in bank loan fees associated with this principal prepayment.
On November 30, 2016, we paid $1.0 million in principal on our Term Loan B, and paid interest due as of that date. We recorded a $2,500 pre-tax loss on the early retirement of long-term debt related to the unamortized discount and $6,900 in bank loan fees associated with this principal prepayment.
On September 30, 2016, we paid $2.3 million in principal on our Term Loan B, of which $1.5 million was an early prepayment of principal, and paid interest due as of that date. We recorded a $3,900 pre-tax loss on the early retirement of long-term debt related to the unamortized discount and $14,000 in bank loan fees associated with this principal prepayment.
On June 30, 2016, we paid $1.2 million in principal on our Term Loan B, of which $0.4 million was an early prepayment of principal, and paid interest due as of that date. We recorded a $1,300 pre-tax loss on the early retirement of long-term debt related to the unamortized discount and $3,400 in bank loan fees associated with this principal prepayment.
On March 31, 2016, we paid the quarterly installment due of $0.8 million in principal on our Term Loan B and paid interest due as of that date.
On March 17, 2016, we paid $0.8 million in principal on our Term Loan B and paid interest due as of that date. We recorded a $2,500 pre-tax loss on the early retirement of long-term debt related to the unamortized discount and $6,700 in bank loan fees associated with this principal repayment.
2016 Equity Transactions
On December 7, 2016, we announced a quarterly equity distribution in the amount of $0.0650 per share on Class A and Class B common stock. The equity distribution of $1.7 million was paid on December 31, 2016 to all Class A and Class B common stockholders of record as of December 19, 2016.
On September 9, 2016, we announced a quarterly equity distribution in the amount of $0.0650 per share on Class A and Class B common stock. The equity distribution of $1.7 million was paid on September 30, 2016 to all Class A and Class B common stockholders of record as of September 19, 2016.
On June 2, 2016, we announced a quarterly equity distribution in the amount of $0.0650 per share on Class A and Class B common stock. The equity distribution of $1.6 million was paid on June 30, 2016 to all Class A and Class B common stockholders of record as of June 16, 2016.
On March 10, 2016, we announced a quarterly equity distribution in the amount of $0.0650 per share on Class A and Class B common stock. The equity distribution of $1.7 million was paid on April 5, 2016 to all Class A and Class B common stockholders of record as of March 22, 2016.
2016 Acquisitions − Broadcast
We acquired or entered agreements to acquire several FM Translators or FM Translator construction permits during the year. The FCC permits AM and FM radio stations to operate FM Translators. The FCC began an AM Revitalization program, or “AMR,” that included several initiatives intended to benefit AM broadcasters. One of these benefits, intended to promote the use of FM Translators by AM broadcasters, allows an AM station to relocate one FM translator up to 250 miles from its authorized site and operate the translator on any non-reserved band FM channel in the AM station’s market, subject to coverage and interference rules (“250 Mile Window”). On February 23, 2017, the FCC amended its rules to allow an AM station using a rebroadcasting FM translator to locate the FM translator anywhere within the AM station’s daytime service contour or anywhere within a 25-mile radius of the transmitter, even if the contour extends farther than 25 miles from the transmitter. This rule change, when it becomes effective, will be particularly useful for finding a location for these translators.
On January 29, 2016, the FCC opened a one-time only 250 Mile Window during which only Class C and Class D AM broadcast stations could participate. This window closed on July 28, 2016. A second window opened on July 29, 2016, allowing Class A and Class B AM broadcast stations to participate in addition to any Class C and Class D AM broadcast station that did not participate in the first 250 Mile Window. The second 250 Mile Window closed on October 31, 2016. During these filing windows, qualifying AM stations were able to apply for one new FM translator station, in the non-reserved FM band to be used solely to re-broadcast the AM station’s AM signal to provide fill-in and/or nighttime service. The FM translator must rebroadcast the related AM station for at least four years, not counting any periods of silence.
In 2017 and 2018, the FCC opened application filing windows wherein AM stations that did not participate in the 250 Mile Windows described above could file an application for a new fill-in FM translator to be used permanently with that AM station. We filed applications in each of the application filing windows.
| 118 |
Construction permits provide authority to construct new FM Translators or make changes in existing facilities. We believe that securing these FM Translators allows us to increase our listening audience by providing enhanced coverage and reach of our existing AM broadcasts that can be heard on FM or expand the listenership of FM HD channels with the potential to create new stations using the HD-2, HD-3 and HD-4 channel capacity.
Our 2016 broadcast acquisitions include the following:
On December 31, 2016, we closed on the acquisition of an FM translator in Aurora, Florida for $50,000 in cash. The FM translator is used by our WHIM-AM radio station in Miami, Florida.
On December 31, 2016, we closed on the acquisition of an FM translator in Port St. Lucie, Florida for $50,000 in cash. The FM translator is used by our WLCC-AM radio station in Tampa, Florida.
On December 14, 2016, we closed on the acquisition of an FM translator in Rhinelander, Wisconsin for $50,000 in cash. The FM translator is used by our WWTC-AM radio station in Minneapolis, Minnesota.
On December 8, 2016, we closed on the acquisition of an FM translator in Little Fish Lake Valley, California for $44,000 in cash. The FM translator is used by our KFIA-AM radio station in Sacramento, California.
On December 1, 2016, we closed on the acquisition of an FM translator in Lake Placid, Florida for $35,000 in cash. The FM translator is used by our WTLN-AM radio station in Orlando, Florida.
On November 22, 2016, we closed on the acquisition of two FM translator construction permits in Lahaina, Hawaii and Kihei, Hawaii for $110,000 in cash. The FM translators is used by our KHNR-AM and KGU-AM radio stations in Honolulu, Hawaii.
On November 22, 2016, we closed on the acquisition of an FM translator in Crested Butte, Colorado for $38,500 in cash. The FM translator is used by our KZNT-AM radio station in Colorado Springs, Colorado.
On November 21, 2016, we closed on the acquisition of an FM translator in Dansville, New York for $75,000 in cash. The FM translator is used by our WMCA-AM radio station in New York, New York.
On November 21, 2016, we closed on the acquisition of an FM translator in Carbondale, Pennsylvania for $75,000 in cash. The FM translator is used by our WPGP-AM radio station in Pittsburgh, Pennsylvania.
On November 11, 2016, we closed on the acquisition of an FM translator construction permit in Kingsville, Texas for $50,000 in cash. The FM translator is used by our KNTH-AM radio station in Houston, Texas.
On November 7, 2016, we closed on the acquisition of an FM translator in Sebring, Florida for $77,000 in cash. The FM translator was used by our WQVN-AM (formerly WKAT-AM) radio station in Miami, Florida.
On October 20, 2016, we closed on the acquisition of radio station KXFN-AM in St. Louis, Missouri for $190,000 in cash. The station was dark upon closing and launched on December 29, 2016. The accompanying consolidated statements of operations included in this annual report on Form 10-K reflect the operating results of this entity as of the closing date and launch date, respectively.
On October 20, 2016, we closed on the acquisition of three FM translator construction permits for $155,000 in cash. The FM translator construction permits were based in Angola, Indiana, Cofax, Indiana and Battle Creek, Michigan and will be used by WHK-AM and WHKW-AM, our radio stations in Cleveland, Ohio and WSDZ-AM our radio station in St. Louis, Missouri.
On October 19, 2016, we closed on the acquisition of an FM translator construction permit in Palm Coast, Florida for $65,000 in cash from a related party. The FM translator will be used by our WTWD-AM radio station in Tampa, Florida.
On October 12, 2016, we closed on the acquisition of an FM translator in Lake City, Florida for $65,000 in cash from a related party. The FM translator will be used by our WBZW-AM radio station in Orlando, Florida.
On June 24, 2016, we entered into an LMA to operate radio station KTRB-AM in San Francisco, California beginning on July 1, 2016. The accompanying consolidated statements of operations included in this annual report on Form 10-K reflect the operating results of this entity as of the LMA date. On December 15, 2016, we entered into a new LMA to operate this station with East Bay Broadcasting, LLC, a related party.
On June 20, 2016, we closed on the acquisition of an FM translator in the Columbus, Ohio market for $0.3 million in cash. The FM translator is used in our Columbus, Ohio market.
On June 10, 2016, we closed on the acquisition of an FM translator in Amherst, New York for $60,000 in cash. The FM translator is used in our Pittsburgh, Pennsylvania market.
| 119 |
On June 8, 2016, we closed on the acquisition of a construction permit for an FM translator construction permit in Charlotte, Michigan for $50,000 in cash. The FM translator is used in our Detroit, Michigan market.
On June 3, 2016, we closed on the acquisition of a construction permit for an FM translator in Atwood, Kentucky for $88,000 in cash. The FM translator is used in our Columbus, Ohio market.
On May 13, 2016, we closed on the acquisition of a construction permit for an FM translator in Kerrville, Texas for $50,000 in cash. The FM translator is used in our Houston, Texas market.
On May 2, 2016, we closed on the acquisition of an FM translator in Lincoln, Maine for $100,000 in cash. The FM translator is used in our Boston, Massachusetts market.
On April 29, 2016, we closed on the acquisition of a construction permit for an FM translator in Emporia, Kansas for $25,000 in cash. The FM translator was relocated to Omaha, Nebraska, for use by our KCRO-AM radio station.
2016 Acquisitions − Digital Media
On December 1, 2016, we acquired ChristianConcertAlerts.com for $0.2 million, of which $0.1 million was paid in cash upon close and the remaining $0.1 million was paid in two $50,000 installments during the year ended December 31, 2017. ChristianConcertAlerts.com provides Christian artists’ tour dates and events across the United States. The website features a location-based calendar that includes over 300 artists and 4,000 venues created by editors and user submissions, as well as artist reviews and album news.
On October 17, 2016, we purchased Historyonthenet.com and Authentichistory.com for $0.1 million. These websites and related social media accounts are operated within our Salem Web Network platform.
On September 13, 2016, we acquired Mike Turner’s line of investment products, including TurnerTrends.com, other domain names and related assets for $0.4 million in cash and the assumption of $0.1 million in deferred subscription liabilities. As part of the purchase agreement, we may pay up to an additional $0.1 million in contingent earn-out consideration over the next twelve months based on the achievement of certain revenue benchmarks. Using a probability-weighted discounted cash flow model based on our own assumptions as to the ability of Turner’s investment products to achieve the revenue targets at the time of closing, we estimated the fair value of the contingent earn-out consideration to be $66,000, which approximated the discounted present value due to the earn-out of less than one year as discussed in more detail in Note 5 – Contingent Earn-Out Consideration. Turner’s investment products offer stock trading advisory newsletters to individual subscribers. We recorded goodwill of approximately $7,200 associated with the expected synergies to be realized upon combining the operations of Turner’s line of investment products into our digital media platform with Eagle Financial Publications and from brand loyalty from its existing subscriber base that is not a separately identifiable intangible asset.
On April 1, 2016, we acquired the Retirement Watch newsletter and websites for $0.1 million in cash and the assumption of $0.6 million in deferred subscription liabilities. Retirement Watch offers non-individualized research and strategies associated with retirement planning. We recorded goodwill of approximately $8,600 associated with the expected synergies to be realized upon combining the operations of Retirement Watch into our digital media platform and brand loyalty from its existing subscriber base that is not a separately identifiable intangible asset.
On March 8, 2016, we acquired King James Bible mobile applications for $4.0 million, of which $2.7 million was paid in cash upon close and $1.3 million is due in deferred installments within one year from the closing date. The deferred installments were amended on May 17, 2016 to include the $0.3 million that was due upon finalization of banking arrangements with the deferred installments. The amended deferred payments of $1.3 million now consist of $0.6 million due within 90 days, $0.3 million due within 180 days and two deferred payments of $0.2 million each due 270 and 360 days from the closing date, respectively. We paid $1.1 million during the year ended December 31, 2016 and $0.2 million during the year ended December 31, 2017. We recorded goodwill of $0.2 million associated with the expected synergies to be realized from combining the operations of these applications into our existing digital media platform. The accompanying consolidated statement of operations reflects the operating results of King James Bible mobile applications as of the closing date within our digital media operating segment.
Throughout the year ended December 31, 2016, we acquired other domain names and assets associated within our digital media operating segment for approximately $3,000 in cash.
2016 Acquisitions − Publishing
On August 1, 2016, we acquired the assets of Hillcrest Media Group, Inc., including Mill City Press and Bookprinting.com, for $3.5 million and the assumption of $1.0 million in deferred revenue liabilities. We paid $3.3 million in cash upon close with the remaining $0.2 million due within 90 days upon the finalization of deferred revenue obligations. Mill City Press and Bookprinting.com provide self-publishing services for general market authors and will be operated within our existing Xulon Press business. We recorded goodwill of approximately $0.8 million associated with the expected synergies to be realized upon combining the operations of Mill City Press and Bookprinting.com into our existing publishing platform and brand loyalty from its existing subscriber base that is not a separately identifiable intangible asset.
| 120 |
Throughout the year ended December 31, 2016, we acquired other domain names and assets associated within our publishing operating segment for approximately $3,000 in cash.
A summary of our business acquisitions and asset purchases during the year ended December 31, 2016, none of which were individually or in the aggregate material to our consolidated financial position as of the respective date of acquisition, is as follows:
| Acquisition Date | Description | Total Consideration | ||||
| (Dollars in thousands) | ||||||
| December 31, 2016 | FM translator, Aurora, Florida (asset purchase) | $ | 50 | |||
| December 31, 2016 | FM translator, Port St. Lucie, Florida (asset purchase) | 50 | ||||
| December 14, 2016 | FM translator, Rhinelander, Wisconsin (asset purchase) | 50 | ||||
| December 8, 2016 | FM translator, Little Fish Lake Valley, California (asset purchase) | 44 | ||||
| December 1, 2016 | FM translator, Lake Placid, Florida (asset purchase) | 35 | ||||
| December 1, 2016 | Christian Concerts Alerts, LLC (asset purchase) | 150 | ||||
| November 22, 2016 | FM translator construction permit, Kihei, Hawaii (asset purchase) | 55 | ||||
| November 22, 2016 | FM translator construction permit, Lahaina, Hawaii (asset purchase) | 55 | ||||
| November 22, 2016 | FM translator, Crested Butte, Colorado (asset purchase) | 39 | ||||
| November 21, 2016 | FM translator, Dansville, New York (asset purchase) | 75 | ||||
| November 21, 2016 | FM translator, Carbondale, Pennsylvania (asset purchase) | 75 | ||||
| November 11, 2016 | FM translator construction permit, Kingsville, Texas (asset purchase) | 50 | ||||
| November 7, 2016 | FM translator, Sebring, Florida (asset purchase) | 77 | ||||
| October 20, 2016 | KXFN-AM, St. Louis, Missouri (business acquisition) | 190 | ||||
| October 20, 2016 | FM translator construction permit, Angola, Indiana (asset purchase) | 50 | ||||
| October 20, 2016 | FM translator construction permit, Cofax, Indiana (asset purchase) | 55 | ||||
| October 20, 2016 | FM translator construction permit, Battle Creek, Michigan (asset purchase) | 50 | ||||
| October 19, 2016 | FM translator construction permit Palm Coast, Florida purchased from a related party (asset purchase) | 65 | ||||
| October 17, 2016 | Historyonthenet.com and Authentichistory.com (asset purchase) | 85 | ||||
| October 12, 2016 | FM translator Lake City, Florida purchased from a related party (asset purchase) | 65 | ||||
| September 13, 2016 | Mike Turner’s investment products and domain names (business acquisition) | 416 | ||||
| August 1, 2016 | Mill City Press and Bookprinting.com (business acquisition) | 3,515 | ||||
| June 20, 2016 | FM translator, Columbus, Ohio (asset purchase) | 345 | ||||
| June 10, 2016 | FM translator, Amherst, New York (asset purchase) | 60 | ||||
| June 8, 2016 | FM translator construction permit, Charlotte, Michigan (asset purchase) | 50 | ||||
| June 3, 2016 | FM translator construction permit, Atwood, Kentucky (asset purchase) | 88 | ||||
| May 13, 2016 | FM translator construction permit, Kerrville, Texas (asset purchase) | 50 | ||||
| May 2, 2016 | FM translator, Lincoln, Maine (asset purchase) | 100 | ||||
| April 29, 2016 | FM translator construction permit, Emporia, Kansas (asset purchase) | 25 | ||||
| April 1, 2016 | Retirement Watch (business acquisition) | 100 | ||||
| March 8, 2016 | King James Bible mobile applications (business acquisition) | 4,000 | ||||
| Various | Purchase of other domain names and assets (asset purchases) | 6 | ||||
| $ | 10,120 | |||||
The following table summarizes the total acquisition consideration for the year ended December 31, 2016:
| Description | Total Consideration | |||
| (Dollars in thousands) | ||||
| Cash payments made upon closing | $ | 8,414 | ||
| Deferred payments | 1,640 | |||
| Present value of estimated fair value of contingent earn-out consideration | 66 | |||
| Total acquisition consideration | $ | 10,120 | ||
| Gain on bargain purchase | 95 | |||
| Fair value of net assets acquired | $ | 10,215 | ||
| 121 |
The fair value of the net assets acquired was allocated as follows:
| Net Broadcast | Net Digital Media | Net Publishing | Net Total | |||||||||||||
| Assets Acquired | Assets Acquired | Assets Acquired | Assets Acquired | |||||||||||||
| (Dollars in thousands) | ||||||||||||||||
| Assets | ||||||||||||||||
| Trade accounts receivable, net of allowances of $42 | $ | — | $ | — | $ | 166 | $166 | |||||||||
| Property and equipment | 224 | 405 | 271 | 900 | ||||||||||||
| Broadcast licenses | 1,719 | — | — | 1,719 | ||||||||||||
| Goodwill | — | 237 | 845 | 1,082 | ||||||||||||
| Domain and brand names | — | 1,129 | 2,121 | 3,250 | ||||||||||||
| Customer lists and contracts | — | 2,576 | — | 2,576 | ||||||||||||
| Subscriber base and lists | — | 675 | — | 675 | ||||||||||||
| Author relationships | — | — | 526 | 526 | ||||||||||||
| Non-compete agreements | — | 289 | 716 | 1,005 | ||||||||||||
| Liabilities | ||||||||||||||||
| Deferred revenue | — | (642 | ) | (1,042 | ) | (1,684) | ||||||||||
| $ | 1,943 | $ | 4,669 | $ | 3,603 | $10,215 | ||||||||||
2016 Divestitures
On September 1, 2016, we received $0.7 million in cash associated with a land easement granted in our South Carolina market.
On June 10, 2016, we received $2.5 million in cash from the National Park Service in exchange for its claim under eminent domain for our tower site in Miami, Florida. We recognized a pre-tax gain of $1.9 million from this claim that is reported in (gain) loss on the sale or disposal of assets and we entered a limited terms of use agreement with the National Park Service to broadcast from the tower site for the next twenty years for a nominal fee.
NOTE 5. CONTINGENT EARN-OUT CONSIDERATION
Our acquisitions may include contingent earn-out consideration as part of the purchase price under which we will make future payments to the seller upon the achievement of certain benchmarks. The fair value of the contingent earn-out consideration is estimated as of the acquisition date at the present value of the expected contingent payments to be made using a probability-weighted discounted cash flow model for probabilities of possible future payments. The present value of the expected future payouts is accreted to interest expense over the earn-out period. The fair value estimates use unobservable inputs that reflect our own assumptions as to the ability of the acquired business to meet the targeted benchmarks and discount rates used in the calculations. The unobservable inputs are defined in FASB ASC Topic 820, Fair Value Measurements and Disclosures, as Level 3 inputs discussed in detail in Note 12.
We review the probabilities of possible future payments to the estimated fair value of any contingent earn-out consideration on a quarterly basis over the earn-out period. Actual results are compared to the estimates and probabilities of achievement used in our forecasts. Should actual results of the acquired business increase or decrease as compared to our estimates and assumptions, the estimated fair value of the contingent earn-out consideration liability will increase or decrease, up to the contracted limit, as applicable. Changes in the estimated fair value of the contingent earn-out consideration are reflected in our results of operations in the period in which they are identified. Changes in the estimated fair value of the contingent earn-out consideration may materially impact and cause volatility in our operating results.
TradersCrux.com
We acquired the TradersCrux.com website and related assets for $0.3 million in cash on July 6, 2017. We paid $0.3 million in cash upon closing and may pay up to an additional $0.1 million in contingent earn-out consideration within one year upon the achievement of income benchmarks. Using a probability-weighted discounted cash flow model based on our own assumptions as to the ability of TradersCrux.com to achieve the income targets at the time of closing, we estimated the fair value of the contingent earn-out consideration to be $18,750, which approximates the discounted present value due to the earn-out of less than one year.
We review the fair value of the contingent earn-out consideration quarterly over the earn-out period to compare actual revenues achieved and projected to the estimated revenues used in our forecasts. Any changes in the estimated fair value of the contingent earn-out consideration will be reflected in our results of operations in the period they are identified, up to the maximum future value outstanding under the contract of $0.1 million. We recorded an increase of $31,000 in the estimated fair value of the contingent earn-out consideration that is reflected in our results of operations for the period ended December 31, 2017. The increase is due to a higher likelihood of achieving the revenue targets based on actual results to date that exceed our original estimates.
Portuguese Bible Mobile Application
We acquired a Portuguese Bible mobile application and related assets on June 8, 2017. We paid $65,000 in cash upon closing and may pay up to an additional $20,000 in contingent earn-out consideration during the twelve month period ended June 8, 2018 based on the achievement of certain revenue benchmarks. Using a probability-weighted discounted cash flow model based on our own assumptions as to the ability of the Portuguese Bible mobile applications to achieve the revenue targets at the time of closing, we estimated the fair value of the contingent earn-out consideration to be $16,500, which approximated the discounted present value due to the earn-out period of less than one year.
| 122 |
We review the fair value of the contingent earn-out consideration quarterly over the earn-out period to compare actual revenues achieved and projected to the estimated revenues used in our forecasts. Any changes in the estimated fair value of the contingent earn-out consideration are reflected in our results of operations in the period they are identified, up to the maximum future value outstanding under the contract of $20,000. We recorded an increase of $1,700 in the estimated fair value of the contingent earn-out consideration that is reflected in our results of operations for period ended December 31, 2017. The increase is due to a higher likelihood of achieving the revenue targets based on actual results to date that exceed our original estimates.
Turner Investment Products
We acquired Mike Turner’s line of investment products, including TurnerTrends.com and other domain names and related assets on September 13, 2016. We paid $0.4 million in cash upon closing and may pay up to an additional $0.1 million in contingent earn-out consideration payable over the next twelve months based on the achievement of certain revenue benchmarks. Using a probability-weighted discounted cash flow model based on our own assumptions as to the ability of Turner’s investment products to achieve the revenue targets at the time of closing, we estimated the fair value of the contingent earn-out consideration to be $66,000, which approximated the discounted present value due to the earn-out period of less than one year. We believe that our experience with digital subscriptions and websites provided a reasonable basis for our estimates.
We reviewed the fair value of the contingent earn-out consideration quarterly over the earn-out period to compare actual subscriber revenues achieved and projected to the estimated subscriber revenues used in our forecasts. Any changes in the estimated fair value of the contingent earn-out consideration were reflected in our results of operations in the period they were identified, up to the maximum future value outstanding under the contract of $0.1 million. As of the end of the earn-out period on September 13, 2017, we recorded a net decrease of $53,000 in the estimated fair value of the contingent earn-out consideration based on actual revenue that was below our estimates that is reflected in our results of operations for period ended December 31, 2017. We made no cash payments to the seller during the earn-out period.
Daily Bible Devotion
We acquired Daily Bible Devotion mobile applications on May 6, 2015. We paid $1.1 million in cash upon closing and may pay up to an additional $0.3 million in contingent earn-out consideration payable over the next two years based upon on the achievement of cumulative session benchmarks for each mobile application. Using a probability-weighted discounted cash flow model based on our own assumptions as to the ability of Bible Devotional Applications to achieve the session benchmarks at the time of closing, we estimated the fair value of the contingent earn-out consideration to be $165,000, which was recorded at the discounted present value of $142,000. The discount was accreted to interest expense over the two-year earn-out period. As of the end of the earn-out period on May 6, 2017, we recorded a net decrease of $4,000 in the estimated fair value of the contingent earn-out consideration based on actual session results at the end of the earn-out period that is reflected in our operating results for the year ended December 31, 2017. Over the total two-year earn out period, we paid a total of $75,000 in cash to the seller, with no cash payments made during the year ended December 31, 2017.
Bryan Perry Newsletters
On February 6, 2015, we acquired the assets and assumed the deferred subscription liabilities for Bryan Perry Newsletters, paying no cash to the seller upon closing. Future contingent earn-out consideration due to the seller is based upon net subscriber revenues achieved over a two-year period from date of close, of which we will pay the seller 50%. There is no minimum or maximum contractual amount due. Using a probability-weighted discounted cash flow model based on our revenue projections at the time of closing, we estimated the fair value of the contingent earn-out consideration to be $171,000, which we recorded at the discounted present value of $158,000. The discount was accreted to interest expense over the two-year earn-out period. We paid a total of $91,000 to the seller over the two year earn out period ended February 6, 2017, of which approximately $14,000 was paid during the year ended December 31, 2017.
Eagle Publishing
On January 10, 2014, we acquired the entities of Eagle Publishing, including Regnery Publishing, HumanEvents.com, RedState.com, Eagle Financial Publications and Eagle Wellness. The base purchase price was $8.5 million, with $3.5 million paid in cash upon closing, and deferred payments of $2.5 million each due January 2015 and January 2016. As part of the purchase agreement, we may pay up to an additional $8.5 million of contingent earn-out consideration during the three year period from the closing date based upon the achievement of certain revenue benchmarks established for calendar years 2014, 2015 and 2016 for each of the Eagle entities. Using a probability-weighted discounted cash flow model based on the likelihood of achievement of the benchmarks at the time of closing, we estimated the fair value of the contingent earn-out consideration to be $2.4 million, which was recorded at the discounted present value of $2.0 million. The discount was accreted to interest expense over the three-year earn-out period. We paid a total of $0.9 million in cash for amounts due under the contingent earn-out over the three year earn out period and recognized a $1.4 million net decrease in the contingent earn-out estimates over the term.
The following table reflects the changes in the present value of our acquisition-related estimated contingent earn-out consideration for the years ended December 31, 2017 and 2016.
| Year Ended December 31, 2017 | ||||||||||||
| Short-Term | Long-Term | |||||||||||
| Accrued Expenses | Other Liabilities | Total | ||||||||||
| (Dollars in thousands) | ||||||||||||
| Beginning Balance as of January 1, 2017 | $ | 66 | $ | — | $ | 66 | ||||||
| Acquisitions | 36 | — | 36 | |||||||||
| Accretion of acquisition-related contingent earn-out consideration | 4 | — | 4 | |||||||||
| Change in the estimated fair value of contingent earn-out consideration | (23 | ) | — | (23 | ) | |||||||
| Reclassification of payments due in next 12 months to short-term | — | — | — | |||||||||
| Payments | (14 | ) | — | (14 | ) | |||||||
| Ending Balance as of December 31, 2017 | $ | 69 | $ | — | $ | 69 | ||||||
| 123 |
| Year Ended December 31, 2016 | ||||||||||||
| Short-Term Accrued Expenses | Long-Term Other Liabilities | Total | ||||||||||
| (Dollars in thousands) | ||||||||||||
| Beginning Balance as of January 1, 2016 | $ | 173 | $ | 602 | $ | 775 | ||||||
| Acquisitions | 66 | — | 66 | |||||||||
| Accretion of acquisition-related contingent earn-out consideration | 17 | 8 | 25 | |||||||||
| Change in the estimated fair value of contingent earn-out consideration | (635 | ) | (54 | ) | (689 | ) | ||||||
| Reclassification of payments due in next 12 months to short-term | 556 | (556 | ) | — | ||||||||
| Payments | (111 | ) | — | (111 | ) | |||||||
| Ending Balance as of December 31, 2016 | $ | 66 | $ | — | $ | 66 | ||||||
NOTE 6. INVENTORIES
Inventories consist of finished goods including books from Regnery Publishing and wellness products. All inventories are valued at the lower of cost or market as determined on a First-In First-Out (“FIFO”) cost method and reported net of estimated reserves for obsolescence.
The following table provides details of inventory on hand by segment:
| As of December 31, | ||||||||
| 2016 | 2017 | |||||||
| (Dollars in thousands) | ||||||||
| Regnery Publishing book inventories | $ | 2,473 | $ | 2,038 | ||||
| Reserve for obsolescence – Regnery Publishing | (2,104 | ) | (1,621 | ) | ||||
| Inventory, net - Regnery Publishing | 369 | 417 | ||||||
| Wellness products | $ | 423 | $ | 349 | ||||
| Reserve for obsolescence – Wellness products | (122 | ) | (36 | ) | ||||
| Inventory, net - Wellness products | 301 | 313 | ||||||
| Consolidated inventories, net | $ | 670 | $ | 730 | ||||
NOTE 7. BROADCAST LICENSES
The following table presents the changes in broadcasting licenses that include acquisitions of radio stations and FM translators as discussed in Note 4 – Acquisitions and Recent Transactions.
| Year Ended December 31, | ||||||||
| 2016 | 2017 | |||||||
| (Dollars in thousands) | ||||||||
| Balance, beginning of period before cumulative loss on impairment | $ | 492,032 | $ | 494,058 | ||||
| Accumulated loss on impairment | (99,001 | ) | (105,541 | ) | ||||
| Balance, beginning of period after cumulative loss on impairment | 393,031 | 388,517 | ||||||
| Acquisitions of radio stations | 74 | 191 | ||||||
| Acquisitions of FM translators and construction permits | 1,645 | 198 | ||||||
| Capital projects to improve broadcast signal and strength | 307 | 5 | ||||||
| Sale of WQVN-AM (formerly WKAT-AM) | - | (7,997 | ) | |||||
| Impairments based on the estimated fair value of broadcast licenses | (6,540 | ) | — | |||||
| Balance, end of period before cumulative loss on impairment | $ | 494,058 | $ | 486,455 | ||||
| Accumulated loss on impairment | (105,541 | ) | (105,541 | ) | ||||
| Balance, end of period after cumulative loss on impairment | $ | 388,517 | $ | 380,914 | ||||
| 124 |
NOTE 8. GOODWILL
The following table presents the changes in goodwill including business acquisitions as described in Note 4 – Acquisitions and Recent Transactions.
| Year Ended December 31, | ||||||||
| 2016 | 2017 | |||||||
| (Dollars in thousands) | ||||||||
| Balance, beginning of period before cumulative loss on impairment, | $ | 26,560 | $ | 27,642 | ||||
| Accumulated loss on impairment | (1,997 | ) | (2,029 | ) | ||||
| Balance, beginning of period after cumulative loss on impairment | 24,563 | 25,613 | ||||||
| Acquisitions of radio stations | — | 14 | ||||||
| Acquisitions of digital media entities | 237 | 810 | ||||||
| Acquisitions of publishing entities | 845 | — | ||||||
| Sale of income generating broadcast business | — | (13 | ) | |||||
| Impairments based on the estimated fair value | (32 | ) | — | |||||
| Balance, end of period before cumulative loss on impairment | 27,642 | 28,453 | ||||||
| Accumulated loss on impairment | (2,029 | ) | (2,029 | ) | ||||
| Ending period balance | $ | 25,613 | $ | 26,424 | ||||
NOTE 9. PROPERTY AND EQUIPMENT
The following is a summary of the categories of our property and equipment:
| As of December 31, | ||||||||
| 2016 | 2017 | |||||||
| (Dollars in thousands) | ||||||||
| Land | $ | 32,402 | $ | 32,320 | ||||
| Buildings | 29,070 | 28,962 | ||||||
| Office furnishings and equipment | 37,386 | 37,583 | ||||||
| Office furnishings and equipment under capital lease obligations | 228 | 244 | ||||||
| Antennae, towers and transmitting equipment | 84,144 | 85,632 | ||||||
| Antennae, towers and transmitting equipment under capital lease obligations | 795 | 795 | ||||||
| Studio, production and mobile equipment | 28,668 | 29,697 | ||||||
| Computer software and website development costs | 20,042 | 24,477 | ||||||
| Record and tape libraries | 27 | 27 | ||||||
| Automobiles | 1,373 | 1,385 | ||||||
| Leasehold improvements | 14,696 | 19,003 | ||||||
| Construction-in-progress | 9,983 | 4,075 | ||||||
| $ | 258,814 | $ | 264,200 | |||||
| Less accumulated depreciation | (156,024 | ) | (164,720 | ) | ||||
| $ | 102,790 | $ | 99,480 | |||||
Depreciation expense was approximately $12.4 million, $12.2 million and $12.4 million for the years ended December 31, 2017, 2016, and 2015, respectively. Included in this amount is $93,000, $96,000 and $108,000 for the years ended December 31, 2017, 2016, and 2015, respectively, on assets acquired under capital lease obligations. Accumulated depreciation associated with these capital lease obligations was $755,000, $662,000 and $566,000 at December 31, 2017, 2016 and 2015, respectively.
NOTE 10. AMORTIZABLE INTANGIBLE ASSETS
The following tables provide a summary of our significant classes of amortizable intangible assets:
| As of December 31, 2017 | ||||||||||||
| Accumulated | ||||||||||||
| Cost | Amortization | Net | ||||||||||
| (Dollars in thousands) | ||||||||||||
| Customer lists and contracts | $ | 22,865 | $ | (20,888 | ) | $ | 1,977 | |||||
| Domain and brand names | 20,109 | (14,650 | ) | 5,459 | ||||||||
| Favorable and assigned leases | 2,379 | (2,028 | ) | 351 | ||||||||
| Subscriber base and lists | 8,797 | (4,701 | ) | 4,096 | ||||||||
| Author relationships | 2,771 | (2,237 | ) | 534 | ||||||||
| Non-compete agreements | 2,029 | (1,342 | ) | 687 | ||||||||
| Other amortizable intangible assets | 1,333 | (1,333 | ) | — | ||||||||
| $ | 60,283 | $ | (47,179 | ) | $ | 13,104 | ||||||
| 125 |
| As of December 31, 2016 | ||||||||||||
| Accumulated | ||||||||||||
| Cost | Amortization | Net | ||||||||||
| (Dollars in thousands) | ||||||||||||
| Customer lists and contracts | $ | 22,599 | $ | (20,070 | ) | $ | 2,529 | |||||
| Domain and brand names | 19,821 | (12,970 | ) | 6,851 | ||||||||
| Favorable and assigned leases | 2,379 | (1,972 | ) | 407 | ||||||||
| Subscriber base and lists | 7,972 | (5,304 | ) | 2,668 | ||||||||
| Author relationships | 2,771 | (1,824 | ) | 947 | ||||||||
| Non-compete agreements | 2,018 | (1,012 | ) | 1,006 | ||||||||
| Other amortizable intangible assets | 1,336 | (1,336 | ) | — | ||||||||
| $ | 58,896 | $ | (44,488 | ) | $ | 14,408 | ||||||
Amortization expense was approximately $4.6 million, $5.1 million and $5.3 million for the years ended December 31, 2017, 2016, and 2015, respectively. Based on the amortizable intangible assets as of December 31, 2017, we estimate amortization expense for the next five years to be as follows:
| Year ended December 31, | Amortization Expense | |||
| (Dollars in thousands) | ||||
| 2018 | $ | 4,576 | ||
| 2019 | 4,006 | |||
| 2020 | 2,714 | |||
| 2021 | 1,159 | |||
| 2022 | 435 | |||
| Thereafter | 214 | |||
| Total | $ | 13,104 | ||
NOTE 11. LONG-TERM DEBT
Salem Media Group, Inc. has no independent assets or operations, the subsidiary guarantees are full and unconditional and joint and several and any subsidiaries of Salem Media Group, Inc. other than the subsidiary guarantors are minor.
6.75% Senior Secured Notes
On May 19, 2017, we issued in a private placement the Notes, which were guaranteed on a senior secured basis by our existing subsidiaries (the “Subsidiary Guarantors”). The Notes bear interest at a rate of 6.75% per year and mature on June 1, 2024, unless earlier redeemed or repurchased. Interest initially accrues on the Notes from May 19, 2017 and is payable semi-annually, in cash in arrears, on June 1 and December 1 of each year, commencing December 1, 2017.
The Notes and the ABL Facility are secured by liens on substantially all of our and the Subsidiary Guarantors’ assets, other than certain excluded assets. The ABL Facility has a first-priority lien on our and the Subsidiary Guarantor’s accounts receivable, inventory, deposit and securities accounts, certain real estate and related assets (the “ABL Priority Collateral”). The Notes are secured by a first-priority lien on substantially all other assets of ours and the Subsidiary Guarantors (the “Notes Priority Collateral”). There is no direct lien on our Federal Communications Commission (“FCC”) licenses to the extent prohibited by law or regulation.
We may redeem the Notes, in whole or in part, at any time on or after June 1, 2020 at a price equal to 100% of the principal amount of the Notes plus a “make-whole” premium as of, and accrued and unpaid interest, if any, to, but not including, the redemption date. At any time on or after June 1, 2020, we may redeem some or all of the Notes at the redemption prices (expressed as percentages of the principal amount to be redeemed) set forth in the Notes, plus accrued and unpaid interest, if any, to, but not including, the redemption date. In addition, we may redeem up to 35% of the aggregate principal amount of the Notes before June 1, 2020 with the net cash proceeds from certain equity offerings at a redemption price of 106.75% of the principal amount plus accrued and unpaid interest, if any, to, but not including, the redemption date. We may also redeem up to 10% of the aggregate original principal amount of the Notes per twelve month period before June 1, 2020 at a redemption price of 103% of the principal amount plus accrued and unpaid interest to, but not including, the redemption date.
| 126 |
The indenture relating to the Notes (the “Indenture”) contains covenants that, among other things and subject in each case to certain specified exceptions, limit our ability and the ability of our restricted subsidiaries to: (i) incur additional debt; (ii) declare or pay dividends, redeem stock or make other distributions to stockholders; (iii) make investments; (iv) create liens or use assets as security in other transactions; (v) merge or consolidate, or sell, transfer, lease or dispose of substantially all of our assets; (vi) engage in transactions with affiliates; and (vii) sell or transfer assets.
The Indenture provides for the following events of default (each, an “Event of Default”): (i) default in payment of principal or premium on the Notes at maturity, upon repurchase, acceleration, optional redemption or otherwise; (ii) default for 30 days in payment of interest on the Notes; (iii) the failure by us or certain restricted subsidiaries to comply with other agreements in the Indenture or the Notes, in certain cases subject to notice and lapse of time; (iv) the failure of any guarantee by certain significant Subsidiary Guarantors to be in full force and effect and enforceable in accordance with its terms, subject to notice and lapse of time; (v) certain accelerations (including failure to pay within any grace period) of other indebtedness of ours or any restricted subsidiary if the amount accelerated (or so unpaid) is at least $15 million; (vi) certain judgments for the payment of money in excess of $15 million; (vii) certain events of bankruptcy or insolvency with respect to us or any significant subsidiary; and (vii) certain defaults with respect to any collateral having a fair market value in excess of $15 million. If an Event of Default occurs and is continuing, the Trustee or the holders of at least 25% in principal amount of the outstanding Notes may declare the principal of the Notes and any accrued interest on the Notes to be due and payable immediately, subject to remedy or cure in certain cases. Certain events of bankruptcy or insolvency are Events of Default which will result in the Notes being due and payable immediately upon the occurrence of such Events of Default.
We are required to pay $17.2 million per year in interest on the Notes. As of December 31, 2017, accrued interest on the Notes was $1.4 million.
We incurred debt issuance costs of $6.3 million that were recorded as a reduction of the debt proceeds that are being amortized to non-cash interest expense over the life of the Notes using the effective interest method. During the year ended December 31, 2017, $0.6 million of debt issuance costs associated with the Notes was amortized to interest expense.
Asset-Based Revolving Credit Facility
On May 19, 2017, the Company also entered into the ABL Facility pursuant to a Credit Agreement (the “Credit Agreement”) by and among us, as a borrower, our subsidiaries party thereto, as borrowers, Wells Fargo Bank, National Association, as administrative agent and lead arranger, and the lenders that are parties thereto. We used the proceeds of the ABL Facility, together with the net proceeds from the Notes offering, to repay outstanding borrowings under our previously existing senior credit facilities, and related fees and expenses. Going forward, the proceeds of the ABL Facility will be used to provide ongoing working capital and for other general corporate purposes (including permitted acquisitions).
The ABL Facility is a five-year $30.0 million revolving credit facility due May 19, 2022, which includes a $5.0 million subfacility for standby letters of credit and a $7.5 million subfacility for swingline loans. All borrowings under the ABL Facility accrue at a rate equal to a base rate or LIBOR rate plus a spread. The spread, which is based on an availability-based measure, ranges from 0.50% to 1.00% for base rate borrowings and 1.50% to 2.00% for LIBOR rate borrowings. If an event of default occurs, the interest rate may increase by 2.00% per annum. Amounts outstanding under the ABL Facility may be paid and then reborrowed at our discretion without penalty or premium. Additionally, we pay a commitment fee on the unused balance of 0.25% to 0.375% per year.
The ABL Facility is secured by a first-priority lien on the ABL Priority Collateral and by a second-priority lien on the Notes Priority Collateral. There is no direct lien on the Company’s FCC licenses to the extent prohibited by law or regulation (other than the economic value and proceeds thereof).
The Credit Agreement includes a springing fixed charge coverage ratio of 1.0 to 1.0, which is tested during the period commencing on the last day of the fiscal month most recently ended prior to the date on which Availability (as defined in the Credit Agreement) is less than the greater of 15% of the Maximum Revolver Amount (as defined in the Credit Agreement) and $4.5 million and continuing for a period of 60 consecutive days after the first day on which Availability exceeds such threshold amount. The Credit Agreement also includes other negative covenants that are customary for credit facilities of this type, including covenants that, subject to exceptions described in the Credit Agreement, restrict the ability of the borrowers and their subsidiaries (i) to incur additional indebtedness; (ii) to make investments; (iii) to make distributions, loans or transfers of assets; (iv) to enter into, create, incur, assume or suffer to exist any liens, (v) to sell assets; (vi) to enter into transactions with affiliates; (vii) to merge or consolidate with, or dispose of all assets to a third party, except as permitted thereby; (viii) to prepay indebtedness; and (ix) to pay dividends.
The Credit Agreement provides for the following events of default: (i) default for non-payment of any principal or letter of credit reimbursement when due or any interest, fees or other amounts within five days of the due date; (ii) the failure by any borrower or any subsidiary to comply with any covenant or agreement contained in the Credit Agreement or any other loan document, in certain cases subject to applicable notice and lapse of time; (iii) any representation or warranty made pursuant to the Credit Agreement or any other loan document is incorrect in any material respect when made; (iv) certain defaults of other indebtedness of any borrower or any subsidiary of indebtedness of at least $10 million; (v) certain events of bankruptcy or insolvency with respect to any borrower or any subsidiary; (vi) certain judgments for the payment of money of $10 million or more; (vii) a change of control; and (viii) certain defaults relating to the loss of FCC licenses, cessation of broadcasting and termination of material station contracts. If an event of default occurs and is continuing, the Administrative Agent and the Lenders may accelerate the amounts outstanding under the ABL Facility and may exercise remedies in respect of the collateral.
| 127 |
We incurred debt issue costs of $0.7 million that were recorded as an asset and are being amortized to non-cash interest expense over the term of the ABL Facility using the effective interest method. During the year ended December 31, 2017, $0.2 million of debt issue costs associated with the Notes was amortized to interest expense. At December 31, 2017, the blended interest rate on amounts outstanding under the ABL Facility was 3.64%.
We report outstanding balances on the ABL Facility as short-term regardless of the maturity date based on use of the ABL Facility to fund ordinary and customary operating cash needs with frequent repayments. We believe that our borrowing capacity under the ABL Facility allows us to meet our ongoing operating requirements, fund capital expenditures and satisfy our debt service requirements for at least the next twelve months.
Prior Term Loan B and Revolving Credit Facility
Our prior credit facility consisted of a term loan of $300.0 million (“Term Loan B”) and a revolving credit facility of $25.0 million (“Revolver”). The Term Loan B was issued at a discount for total net proceeds of $298.5 million. The discount was amortized to non-cash interest expense over the life of the loan using the effective interest method. For the year ended December 31, 2017, 2016 and 2015, approximately $74,000, $206,000 and $188,000, respectively, of the discount associated with the Term Loan B was amortized to interest expense.
The Term Loan B had a term of seven years, maturing in March 2020. On May 19, 2017, we used the net proceeds of the Notes and a portion of the ABL Facility to fully repay amounts outstanding under the Term Loan B of $258.0 million and under the Revolver of $4.1 million. We recorded a pre-tax loss on the early retirement of long-term debt of $2.1 million, which included $1.5 million of unamortized debt issuance costs on the Term Loan B and the Revolver and $0.6 million of unamortized discount on the Term Loan B.
The following payments or prepayments of the Term Loan B were made during the year ended December 31, 2016 and through the date of the termination, including interest through the payment date as follows:
| Date | Principal Paid | Unamortized Discount | ||||||
| (Dollars in Thousands) | ||||||||
| May 19, 2017 | $ | 258,000 | $ | 550 | ||||
| February 28, 2017 | 3,000 | 6 | ||||||
| January 30, 2017 | 2,000 | 5 | ||||||
| December 30, 2016 | 5,000 | 12 | ||||||
| November 30, 2016 | 1,000 | 3 | ||||||
| September 30, 2016 | 1,500 | 4 | ||||||
| September 30, 2016 | 750 | — | ||||||
| June 30, 2016 | 441 | 1 | ||||||
| June 30, 2016 | 750 | — | ||||||
| March 31, 2016 | 750 | — | ||||||
| March 17, 2016 | 809 | 2 | ||||||
Debt issuance costs were amortized to non-cash interest expense over the life of the Term Loan B using the effective interest method. For the year ended December 31, 2017, 2016 and 2015, approximately $203,000, $562,000 and $558,000, respectively, of the debt issuance costs associated with the Term Loan B was amortized to interest expense.
Debt issuance costs associated with the Revolver were recorded as an asset in accordance with ASU 2015-15. The costs were amortized to non-cash interest expense over the five year life of the Revolver using the effective interest method based on an imputed interest rate of 4.58%. For the year ended December 31, 2017, 2016 and 2015, we recorded amortization of deferred financing costs of approximately $26,000, $70,000 and $68,000, respectively.
Summary of long-term debt obligations
Long-term debt consisted of the following:
| As of December 31, | ||||||||
| 2016 | 2017 | |||||||
| (Dollars in thousands) | ||||||||
| 6.75% Senior Secured Notes | $ | — | $ | 255,000 | ||||
| Less unamortized debt issuance costs based on imputed interest rate of 7.08% | — | (5,774 | ) | |||||
| 6.75% Senior Secured Notes net carrying value | — | 249,226 | ||||||
| Asset-Based Revolving Credit Facility principal outstanding | — | 9,000 | ||||||
| Term Loan B principal amount | 263,000 | — | ||||||
| Less unamortized discount and debt issuance costs based on imputed interest rate of 4.78% | (2,371 | ) | — | |||||
| Term Loan B net carrying value | 260,629 | — | ||||||
| Revolver principal outstanding | 477 | — | ||||||
| Capital leases and other loans | 568 | 462 | ||||||
| Long-term debt and capital lease obligations less unamortized debt issuance costs | 261,674 | 258,688 | ||||||
| Less current portion | (590 | ) | (9,109 | ) | ||||
| Long-term debt and capital lease obligations less unamortized debt issuance costs, net of current portion | $ | 261,084 | $ | 249,579 | ||||
| 128 |
In addition to the outstanding amounts listed above, we also have interest payments related to our long-term debt as follows as of December 31, 2017:
| · | Outstanding borrowings of $9.0 million under the ABL Facility, with interest payments ranges from 0.50% to 1.00% for base rate borrowings and 1.50% to 2.00% for LIBOR rate borrowings; |
| · | $255.0 million aggregate principal amount of Notes with semi-annual interest payments at an annual rate of 6.75%; and |
| · | Commitment fee of 0.25% to 0.375% per annum on the unused portion of the ABL Facility. |
Other Debt
We have several capital leases related to office equipment. The obligation recorded at December 31, 2017 and December 31, 2016 represents the present value of future commitments under the capital lease agreements.
Maturities of Long-Term Debt and Capital Lease Obligations
Principal repayment requirements under all long-term debt agreements outstanding at December 31, 2017 for each of the next five years and thereafter are as follows:
| Amount | ||||
| For the Year Ended December 31, | (Dollars in thousands) | |||
| 2018 | $ | 9,109 | ||
| 2019 | 107 | |||
| 2020 | 110 | |||
| 2021 | 125 | |||
| 2022 | 11 | |||
| Thereafter | 255,000 | |||
| $ | 264,462 | |||
NOTE 12. FAIR VALUE MEASUREMENTS AND DISCLOSURES
FASB ASC Topic 820 Fair Value Measurements and Disclosures, established a hierarchal disclosure framework associated with the level of pricing observability utilized in measuring fair value. This framework defines three levels of inputs to the fair value measurement process and requires that each fair value measurement be assigned to a level corresponding to the lowest level input that is significant to the fair value measurement in its entirety. The three broad levels of inputs defined by the FASB ASC Topic 820 hierarchy are as follows:
| • | Level 1 Inputs—quoted prices (unadjusted) in active markets for identical assets or liabilities that the reporting entity has the ability to access at the measurement date; |
| • | Level 2 Inputs—inputs other than quoted prices included within Level 1 that are observable for the asset or liability, either directly or indirectly. If the asset or liability has a specified (contractual) term, a Level 2 input must be observable for substantially the full term of the asset or liability; and |
| • | Level 3 Inputs—unobservable inputs for the asset or liability. These unobservable inputs reflect the entity’s own assumptions about the assumptions that market participants would use in pricing the asset or liability, and are developed based on the best information available in the circumstances (which might include the reporting entity’s own data). |
As of December 31, 2017, the carrying value of cash and cash equivalents, trade accounts receivables, accounts payable, accrued expenses and accrued interest approximates fair value due to the short-term nature of such instruments. The carrying amount of the Notes at December 31, 2017 was $255.0 million, which approximated the fair value based on the prevailing interest rates and trading activity of our Notes.
We have certain assets that are measured at fair value on a non-recurring basis that are adjusted to fair value only when the carrying values exceed the fair values. The categorization of the framework used to price the assets is considered Level 3 due to the subjective nature of the unobservable inputs used when estimating the fair value. During the fourth quarter of 2016, we estimated the fair value of broadcast licenses and mastheads using significant unobservable inputs (Level 3). We adjusted four of our broadcast market clusters and mastheads to their estimated fair value and recorded a combined impairment loss of $7.0 million. See Note 2 – Impairment of Goodwill and Other Indefinite Lived Intangible Assets.
| 129 |
The following table summarizes the fair value of our financial assets and liabilities that are measured at fair value:
| December 31, 2017 | ||||||||||||||||
| Carrying Value on | Fair Value Measurement Category | |||||||||||||||
| Balance Sheet | Level 1 | Level 2 | Level 3 | |||||||||||||
| (Dollars in thousands) | ||||||||||||||||
| Assets | ||||||||||||||||
| Estimated fair value of other indefinite-lived intangible assets | 313 | 313 | ||||||||||||||
| Liabilities: | ||||||||||||||||
| Estimated fair value of contingent earn-out consideration included in accrued expenses | 69 | — | — | 69 | ||||||||||||
| Long-term debt and capital lease obligations less unamortized debt issuance costs | 258,688 | — | 258,688 | — | ||||||||||||
NOTE 13. INCOME TAXES
We recognize deferred tax assets and liabilities for future tax consequences attributable to differences between our consolidated financial statement carrying amount of assets and liabilities and their respective tax bases. We measure these deferred tax assets and liabilities using enacted tax rates expected to apply in the years in which these temporary differences are expected to reverse. We recognize the effect on deferred tax assets and liabilities resulting from a change in tax rates in income in the period that includes the date of the change. On December 22, 2017, the Tax Cuts and Jobs Act of 2017 (the “Act”) was signed into law making significant changes to the Internal Revenue Code. Changes include, but are not limited to, a corporate tax rate decrease from 35% to 21% effective for tax years beginning after December 31, 2017. We have calculated our best estimate of the impact of the Act in our year end income tax provision in accordance with our understanding of the Act and guidance available as of the date of this filing.
For financial reporting purposes, we recorded a valuation allowance of $6.2 million as of December 31, 2017 to offset $6.0 million of the deferred tax assets related to the state net operating loss carryforwards and $0.2 million associated with asset impairments. For financial reporting purposes, we recorded a valuation allowance of $4.5 million as of December 31, 2016 to offset $4.2 million of the deferred tax assets related to the state net operating loss carryforwards and $0.3 million associated with asset impairments. During the third quarter of 2016, we identified an error in our estimated valuation allowance for certain deferred tax assets. We recorded an out-of-period adjustment to increase our valuation allowance by $1.6 million for a portion of the deferred tax assets related to state net operating loss carryforwards that we determined were more likely than not to be unrealized.
The consolidated provision for (benefit from) income taxes is as follows:
| Year Ended December 31, | ||||||||||||
| 2015 | 2016 | 2017 | ||||||||||
| (Dollars in thousands) | ||||||||||||
| Current: | ||||||||||||
| Federal | $ | — | $ | — | $ | — | ||||||
| State | 249 | 229 | 63 | |||||||||
| 249 | 229 | 63 | ||||||||||
| Deferred: | ||||||||||||
| Federal | 6,234 | 4,938 | (21,167 | ) | ||||||||
| State | 212 | (595 | ) | 234 | ||||||||
| 6,446 | 4,343 | (20,933 | ) | |||||||||
| Provision for (benefit from) income taxes | $ | 6,695 | $ | 4,572 | $ | (20,870 | ) | |||||
Consolidated deferred tax assets and liabilities consist of the following:
| As of December 31, | ||||||||
| 2016 | 2017 | |||||||
| (Dollars in thousands) | ||||||||
| Deferred tax assets: | ||||||||
| Financial statement accruals not currently deductible | $ | 9,324 | $ | 6,220 | ||||
| Net operating loss, AMT credit and other carryforwards | 71,215 | 55,720 | ||||||
| State taxes | 87 | 103 | ||||||
| Other | 740 | 2,191 | ||||||
| Total deferred tax assets | 81,366 | 64,234 | ||||||
| Valuation allowance for deferred tax assets | (4,487 | ) | (6,154 | ) | ||||
| Net deferred tax assets | $ | 76,879 | $ | 58,080 | ||||
| Deferred tax liabilities: | ||||||||
| Excess of net book value of property and equipment and software for financial reporting purposes over tax basis | $ | 2,096 | $ | 1,218 | ||||
| Excess of net book value of intangible assets for financial reporting purposes over tax basis | 128,988 | 89,898 | ||||||
| Interest rate swap | (193 | ) | — | |||||
| Unrecognized tax benefits | — | — | ||||||
| Other | — | 45 | ||||||
| Total deferred tax liabilities | 130,891 | 91,161 | ||||||
| Net deferred tax liabilities | $ | (54,012 | ) | $ | (33,081 | ) | ||
| 130 |
The following table reconciles the above net deferred tax liabilities to the financial statements:
| As of December 31, | ||||||||
| 2016 | 2017 | |||||||
| (Dollars in thousands) | ||||||||
| Deferred income tax asset per balance sheet | $ | 9,411 | $ | 1,070 | ||||
| Deferred income tax liability per balance sheet | (63,423 | ) | (34,151 | ) | ||||
| $ | (54,012 | ) | $ | (33,081 | ) | |||
A reconciliation of the statutory federal income tax rate to the provision for income tax is as follows:
| Year Ended December 31, | ||||||||||||
| 2015 | 2016 | 2017 | ||||||||||
| (Dollars in thousands) | ||||||||||||
| Statutory federal income tax rate (at 35%) | $ | 6,246 | $ | 4,706 | $ | 1,321 | ||||||
| Effect of state taxes, net of federal | 458 | (486 | ) | (1,207 | ) | |||||||
| Permanent items | 445 | 266 | 458 | |||||||||
| State rate change | 23 | (1,664 | ) | (179 | ) | |||||||
| Valuation allowance | (181 | ) | 1,763 | 1,667 | ||||||||
| Tax Cuts and Jobs Act of 2017 | — | — | (23,000 | ) | ||||||||
| Other, net | (296 | ) | (13 | ) | 70 | |||||||
| Provision for income taxes | $ | 6,695 | $ | 4,572 | $ | (20,870 | ) | |||||
At December 31, 2017, we had net operating loss carryforwards for federal income tax purposes of approximately $153.1 million that expire in 2020 through 2037 and for state income tax purposes of approximately $790.4 million that expire in years 2018 through 2037. For financial reporting purposes at December 31, 2017, we had a valuation allowance of $6.2 million, net of federal benefit, to offset $6.0 million of the deferred tax assets related to the state net operating loss carryforwards and $0.2 million associated with asset impairments. Our evaluation was performed for tax years that remain subject to examination by major tax jurisdictions, which range from 2013 through 2016.
The amortization of our indefinite-lived intangible assets for tax purposes but not for book purposes creates deferred tax liabilities. A reversal of deferred tax liabilities may occur when indefinite-lived intangibles: (1) become impaired; or (2) are sold, which would typically only occur in connection with the sale of the assets of a station or groups of stations or the entire company in a taxable transaction. Due to the amortization for tax purposes and not book purposes of our indefinite-lived intangible assets, we expect to continue to generate deferred tax liabilities in future periods exclusive of any impairment losses in future periods. These deferred tax liabilities and net operating loss carryforwards result in differences between our provision for income tax and cash paid for taxes.
NOTE 14. COMMITMENTS AND CONTINGENCIES
The Company enters into various agreements in the normal course of business that contain minimum guarantees. These minimum guarantees are often tied to future events, such as future revenue earned in excess of the contractual level. Accordingly, the fair value of these arrangements is zero.
The Company also records contingent earn-out consideration representing the estimated fair value of future liabilities associated with acquisitions that may have additional payments due upon the achievement of certain performance targets. The fair value of the contingent earn-out consideration is estimated as of the acquisition date as the present value of the expected contingent payments as determined using weighted probabilities of the expected payment amounts. We review the probabilities of possible future payments to estimate the fair value of any contingent earn-out consideration on a quarterly basis over the earn-out period. Actual results are compared to the estimates and probabilities of achievement used in our forecasts. Should actual results of the acquired business increase or decrease as compared to our estimates and assumptions, the estimated fair value of the contingent earn-out consideration liability will increase or decrease, up to the contracted limit, as applicable. Changes in the estimated fair value of the contingent earn-out consideration are reflected in our results of operations in the period in which they are identified. Changes in the estimated fair value of the contingent earn-out consideration may materially impact and cause volatility in our operating results.
The Company and its subsidiaries, incident to its business activities, are parties to a number of legal proceedings, lawsuits, arbitration and other claims. Such matters are subject to many uncertainties and outcomes that are not predictable with assurance. We evaluate claims based on what we believe to be both probable and reasonably estimable. With the exception of the matter described below, we are unable to ascertain the ultimate aggregate amount of monetary liability or the financial impact with respect to these matters. The company maintains insurance that may provide coverage for such matters.
In April 2016, pursuant to a counterclaim to a collection suit initiated by Salem, an award was issued against Salem for breach of contract and attorney fees. While we have filed an appeal against the award as well as a malpractice lawsuit against the lawyer that represented Salem in the suit, we recorded a legal reserve of $0.5 million as of March 31, 2016. This reserve represents the total possible loss contingency without third party recoveries from our appeal, malpractice lawsuit or insurance claims. There have been no changes in our estimates as of the date of this filing.
| 131 |
The company believes, at this time, that the final resolution of these matters, individually and in the aggregate, will not have a material adverse effect upon the Company’s consolidated financial position, results of operations or cash flows.
Salem leases various land, offices, studios and other equipment under operating leases that generally expire over the next ten to twenty-five years. The majority of these leases are subject to escalation clauses and may be renewed for successive periods ranging from one to five years on terms similar to current agreements and except for specified increases in lease payments. Rental expense included in operating expense under all lease agreements was $20.3 million, $19.8 million and $19.1 million in 2017, 2016 and 2015, respectively.
Future minimum rental payments required under operating leases that have initial or remaining non-cancelable lease terms in excess of one year as of December 31, 2017, are as follows:
| Related Parties | Other | Total | ||||||||||
| (Dollars in thousand) | ||||||||||||
| 2018 | $ | 1,048 | $ | 12,101 | $ | 13,149 | ||||||
| 2019 | 790 | 11,249 | 12,039 | |||||||||
| 2020 | 806 | 10,701 | 11,507 | |||||||||
| 2021 | 794 | 9,202 | 9,996 | |||||||||
| 2022 | 919 | 7,498 | 8,417 | |||||||||
| Thereafter | 5,657 | 27,420 | 33,077 | |||||||||
| $ | 10,014 | $ | 78,171 | $ | 88,185 | |||||||
NOTE 15. STOCK INCENTIVE PLAN
Our Amended and Restated 1999 Stock Incentive Plan (the “Plan”) provides for grants of equity-based awards to employees, non-employee directors and officers, and advisors of the company (“Eligible Persons”). The Plan is designed to promote the interests of the company using equity investment interests to attract, motivate, and retain individuals.
A maximum of 5,000,000 shares of common stock are authorized under the Plan. All awards have restriction periods tied primarily to employment and/or service. The Plan allows for accelerated or continued vesting in certain circumstances as defined in the Plan including death, disability, a change in control, and termination or retirement. The Board of Directors, or a committee appointed by the Board, has discretion subject to limits defined in the Plan, to modify the terms of any outstanding award.
Under the Plan, the Board, or a committee appointed by the Board, may impose restrictions on the exercise of awards during pre-defined blackout periods. Insiders may participate in plans established pursuant to Rule 10b5-1 under the Exchange Act that allow them to exercise awards subject to pre-established criteria.
We recognize non-cash stock-based compensation expense based on the estimated fair value of awards in accordance with FASB ASC Topic 718 Compensation—Stock Compensation. Stock-based compensation expense fluctuates over time as a result of the vesting periods for outstanding awards and the number of awards that actually vest. We adopted ASU 2016-09, Improvements to Employee Share-Based Payment Accounting as of January 1, 2017. The adoption of this ASU did not materially impact our financial position, results of operations, or cash flows.
The following table reflects the components of stock-based compensation expense recognized in the Consolidated Statements of Operations for the years ended December 31, 2015, 2016 and 2017:
| Year Ended December 31, | ||||||||||||
| 2015 | 2016 | 2017 | ||||||||||
| (Dollars in thousands) | ||||||||||||
| Stock option compensation expense included in unallocated corporate expenses | $ | 474 | $ | 378 | $ | 153 | ||||||
| Restricted stock shares compensation expense included in unallocated corporate expenses | 34 | 24 | 1,100 | |||||||||
| Stock option compensation expense included in broadcast operating expenses | 130 | 85 | 33 | |||||||||
| Restricted stock shares compensation expense included in broadcast operating expenses | — | — | 224 | |||||||||
| Stock option compensation expense included in digital media operating expenses | 92 | 60 | 30 | |||||||||
| Restricted stock shares compensation expense included in digital media operating expenses | — | — | 124 | |||||||||
| Stock option compensation expense included in publishing operating expenses | 41 | 35 | 21 | |||||||||
| Restricted stock shares compensation expense included in publishing operating expenses | — | — | 36 | |||||||||
| Total stock-based compensation expense, pre-tax | $ | 771 | $ | 582 | $ | 1,721 | ||||||
| Tax expense from stock-based compensation expense | (308 | ) | (233 | ) | (688 | ) | ||||||
| Total stock-based compensation expense, net of tax | $ | 463 | $ | 349 | $ | 1,033 | ||||||
| 132 |
Stock option and restricted stock grants
Eligible employees may receive stock option awards annually with the number of shares and type of instrument generally determined by the employee’s salary grade and performance level. Incentive and non-qualified stock option awards allow the recipient to purchase shares of our common stock at a set price, not to be less than the closing market price on the date of award, for no consideration payable by the recipient. The related number of shares underlying the stock option is fixed at the time of the grant. Options generally vest over a four-year period with a maximum term of five years from the vesting date. In addition, certain management and professional level employees may receive stock option awards upon the commencement of employment.
The Plan also allows for awards of restricted stock, which have been granted periodically to non-employee directors of the company. Awards granted to non-employee directors are made in exchange for their services to the company as directors and therefore, the guidance in FASB ASC Topic 505-50 Equity Based Payments to Non Employees is not applicable. Restricted stock awards contain transfer restrictions under which they cannot be sold, pledged, transferred or assigned until the period specified in the award, generally from one to five years. Restricted stock awards are independent of option grants and are granted at no cost to the recipient other than applicable taxes owed by the recipient. The awards are considered issued and outstanding from the vest date of grant.
The fair value of each award is estimated as of the date of the grant using the Black-Scholes valuation model. The expected volatility reflects the consideration of the historical volatility of our common stock as determined by the closing price over a six to ten year term commensurate with the expected term of the award. Expected dividends reflect the amount of quarterly distributions authorized and declared on our Class A and Class B common stock as of the grant date. The expected term of the awards are based on evaluations of historical and expected future employee exercise behavior. The risk-free interest rates for periods within the expected term of the award are based on the U.S. Treasury yield curve in effect during the period the options were granted. We have used historical data to estimate future forfeiture rates to apply against the gross amount of compensation expense determined using the valuation model. These estimates have approximated our actual forfeiture rates.
There were no stock options granted during the year ended December 31, 2017. The weighted-average assumptions used to estimate the fair value of the stock options and restricted stock awards using the Black-Scholes valuation model were as follows for the years ended December 31, 2015 and 2016:
| Year Ended December 31, | ||||||||
| 2015 | 2016 | |||||||
| Expected volatility | 52.37 | % | 47.03 | % | ||||
| Expected dividends | 4.28 | % | 5.36 | % | ||||
| Expected term (in years) | 3.0 | 7.4 | ||||||
| Risk-free interest rate | 0.85 | % | 1.64 | % | ||||
Activity with respect to the company’s option awards during the three years ended December 31, 2017 is as follows (Dollars in thousands, except weighted average exercise price and weighted average grant date fair value):
| Options | Shares | Weighted Average Exercise Price | Weighted Average Grant Date Fair Value | Weighted Average Remaining Contractual Term | Aggregate Intrinsic Value | |||||||||||||
| Outstanding at January 1, 2015 | 1,816,204 | $ | 4.88 | $ | 3.39 | 5.5 years | $ | 5,718 | ||||||||||
| Granted | 10,000 | 6.08 | 1.98 | — | ||||||||||||||
| Exercised | (163,994 | ) | 2.35 | 1.53 | 589 | |||||||||||||
| Forfeited or expired | (81,087 | ) | 10.32 | 6.93 | 12 | |||||||||||||
| Outstanding at December 31, 2015 | 1,581,123 | $ | 4.87 | $ | 3.39 | 4.3 years | $ | 1,738 | ||||||||||
| Exercisable at December 31, 2015 | 947,573 | 4.92 | 3.54 | 3.3 years | 1,001 | |||||||||||||
| Outstanding at January 1, 2016 | 1,581,123 | $ | 4.87 | $ | 3.39 | 4.3 years | $ | 1,738 | ||||||||||
| Granted | 549,500 | 4.85 | 1.33 | — | ||||||||||||||
| Exercised | (336,996 | ) | 2.95 | 2.02 | 1,418 | |||||||||||||
| Forfeited or expired | (73,627 | ) | 8.06 | 3.07 | 3 | |||||||||||||
| Outstanding at December 31, 2016 | 1,720,000 | $ | 5.12 | $ | 2.89 | 4.5 years | $ | 2,428 | ||||||||||
| Exercisable at December 31, 2016 | 841,625 | 5.56 | 3.94 | 2.9 years | 948 | |||||||||||||
| Expected to Vest | 601,557 | $ | 4.80 | $ | 3.15 | 5.6 years | $ | 700 | ||||||||||
| Outstanding at January 1, 2017 | 1,720,000 | $ | 5.12 | $ | 2.89 | 4.5 years | $ | 2,428 | ||||||||||
| Granted | — | |||||||||||||||||
| Exercised | (127,663 | ) | 4.02 | 2.03 | 401 | |||||||||||||
| Forfeited or expired | (163,875 | ) | 5.75 | 2.99 | 136 | |||||||||||||
| Outstanding at December 31, 2017 | 1,428,462 | $ | 5.20 | $ | 2.96 | 3.7 years | $ | 653 | ||||||||||
| Exercisable at December 31, 2017 | 934,959 | 5.66 | 3.77 | 2.7 years | 414 | |||||||||||||
| Expected to Vest | 468,581 | $ | 5.21 | $ | 2.98 | 3.7 years | $ | 239 | ||||||||||
| 133 |
The aggregate intrinsic value represents the difference between the company’s closing stock price on December 31, 2017 of $4.50 and the option exercise price of the shares for stock options that were in the money, multiplied by the number of shares underlying such options. The total fair value of options vested during the years ended December 31, 2017, 2016 and 2015 was $0.9 million, $1.1 million and $1.5 million, respectively.
As of December 31, 2017, there was $0.3 million of total unrecognized compensation cost related to non-vested stock option awards. This cost is expected to be recognized over a weighted-average period of 1.5 years.
On August 9, 2017, a restricted stock award of 33,066 shares was granted to an executive that vested immediately. The fair value of the restricted stock award was measured based on the grant date market price of our common shares and expensed as of the vesting date. The restricted stock award contained transfer restrictions under which they could not be sold, pledged, transferred or assigned until 90 days from the vesting date. The recipient of this restricted stock award is entitled to all of the rights of absolute ownership of the restricted stock from the date of grant, including the right to vote the shares and to receive dividends. Restricted stock awards are independent of option grants and are granted at no cost to the recipient other than applicable taxes owed by the recipient. The award is considered issued and outstanding from the vest date of grant.
On February 24, 2017, a restricted stock award of a total of 178,592 shares was granted to certain members of management that vested immediately. The fair value of each restricted stock award was measured based on the grant date market price of our common shares and expensed as of the vesting date. These restricted stock awards contained transfer restrictions under which they could not be sold, pledged, transferred or assigned until three months from the vesting date. Recipients of these restricted stock awards were entitled to all of the rights of absolute ownership of the restricted stock from the date of grant including the right to vote the shares and to receive dividends. Restricted stock awards are independent of option grants and are granted at no cost to the recipient other than applicable taxes owed by the recipient. The awards were considered issued and outstanding from the vest date of grant.
The fair values of shares of restricted stock awards are determined based on the closing price of the company’s common stock on the grant dates. Activity with respect to the company’s restricted stock awards during the year ended December 31, 2017 and 2016 is as follows:
| Restricted Stock Awards | Shares | Weighted Average
Grant Date Fair Value | Weighted Average Remaining Contractual Term | Aggregate Intrinsic Value | ||||||||||
| Non-Vested at January 1, 2016 | 10,000 | $ | 5.83 | 0.2 years | $ | 40 | ||||||||
| Granted | — | — | — | — | ||||||||||
| Lapse of restrictions | (10,000 | ) | (5.83 | ) | — | 52 | ||||||||
| Forfeited or expired | — | — | — | — | ||||||||||
| Outstanding at December 31, 2016 | — | $ | — | — | $ | — | ||||||||
| Restricted Stock Awards | Shares | Weighted Average
Grant Date Fair Value | Weighted Average Remaining Contractual Term | Aggregate Intrinsic Value | ||||||||||
| Non-Vested at January 1, 2017 | — | $ | — | — years | $ | — | ||||||||
| Granted | 211,658 | 7.01 | — | 1,484 | ||||||||||
| Lapse of restrictions | (211,658 | ) | (7.01 | ) | — | 1,488 | ||||||||
| Forfeited or expired | — | — | — | — | ||||||||||
| Outstanding at December 31, 2017 | — | $ | — | — | $ | — | ||||||||
Additional information regarding options outstanding as of December 31, 2017, is as follows:
| Weighted Average | ||||||||||||||||||
| Contractual Life | Weighted | Weighted Average | ||||||||||||||||
| Range of | Remaining | Average | Exercisable | Grant Date | ||||||||||||||
| Exercise Prices | Options | (Years) | Exercise Price | Options | Fair Value | |||||||||||||
| $2.38 - $3.37 | 351,370 | 3.2 | $ | 2.65 | 215,370 | $ | 2.59 | |||||||||||
| $3.38 - $4.42 | 4,250 | 2.2 | 3.99 | 4,250 | 3.99 | |||||||||||||
| $4.43 - $4.85 | 428,292 | 5.7 | 4.85 | 83,039 | 4.85 | |||||||||||||
| $4.86 - $6.65 | 61,000 | 1.3 | 5.35 | 57,250 | 5.38 | |||||||||||||
| $6.66 - $7.54 | 553,550 | 2.7 | 6.92 | 553,550 | 6.92 | |||||||||||||
| $7.55 - $8.76 | 30,000 | 3.8 | 8.37 | 21,500 | 8.38 | |||||||||||||
| 1,428,462 | 3.7 | $ | 5.20 | 934,959 | $ | 5.66 | ||||||||||||
NOTE 16. RELATED PARTY TRANSACTIONS
Our board of directors has adopted a written policy for review, approval and monitoring of transactions between the company and its related parties. Related parties include our directors, executive officers, nominees to become a director, any person beneficially owning more than 5% of any class of our stock, immediate family members of any of the foregoing, and any entity in which any of the foregoing persons is employed or is a general partner or principal or in which the person has a 10% or greater beneficial ownership interest. The policy covers material transactions in which a related party had, has or will have a direct or indirect interest.
| 134 |
On November 22, 2017, we closed on the acquisition of radio station WSPZ-AM (now WWRC-AM) in Bethesda, Maryland for $0.6 million in cash from AM 570, LLC, a company owned by Edward G. Atsinger III, Chief Executive Officer and Stuart W. Epperson, Chairman of the Board. We began programming the station within our Washington DC market as of September 15, 2017 under a LMA with AM 570 LLC. We assumed the lease agreement for the land, tower and broadcasting equipment of WSPZ-AM (now WWRC-AM) as of the closing date.
During the year ended December 31, 2017, we paid approximately $21,000 to Delmarva Educational Association Corporation, a related party entity which Nancy A. Epperson, the wife of the Chairman of the Board, and Stuart W. Epperson Jr., the son of the Chairman of the Board, serve as directors. The payments represented commissions due to Delmarva under a revenue sharing promotion.
On December 15, 2016, we entered into a related party LMA with East Bay Broadcasting, LLC, a company owned by Edward G. Atsinger III, Chief Executive Officer and Stuart W. Epperson, Chairman of the Board, to operate radio station KTRB-AM in San Francisco, California. During the year ended December 31, 2017, we paid approximately $0.5 million to Easy Bay Broadcasting, LLC under the LMA.
Leases with Principal Stockholders
A trust controlled by the Chief Executive Officer of the company, Edward G. Atsinger III, owns real estate on which assets of one radio station are located. Salem has entered into a lease agreement with this trust. Rental expense related to this lease included in operating expense for 2017, 2016 and 2015 amounted to $191,000, $185,000, and $180,000, respectively.
Land and buildings occupied by various Salem radio stations are leased from entities owned by the company’s CEO and its Chairman of the Board. Rental expense under these leases included in operating expense for 2017, 2016 and 2015 amounted to $1.5 million, $1.5 million, and $1.3 million, respectively.
On September 15, 2017, we entered a lease with AM 570, LLC, a company owned by Edward G. Atsinger III, Chief Executive Officer and Stuart W. Epperson, Chairman of the Board for land, tower and broadcasting facilities, of radio station WSPZ-AM (now WWRC-AM) in Bethesda, Maryland. Our Nominating and Corporate Governance Committee reviewed the lease terms and determined that the terms of the transaction were no less favorable to Salem than those that would be available in a comparable transaction in arm’s length dealings with an unrelated third party. We sold the related land, tower and broadcasting facility to an unrelated third party on December 28, 2017. The unrelated third party assumed the existing income generating leases acquired with the broadcast tower, including the AM 570 LLC lease.
Radio Stations Owned by the Epperson’s
Nancy A. Epperson, the wife of the Chairman of the Board, Stuart W. Epperson, currently serves as an officer, director and stockholder of six radio stations in Virginia, five radio stations in North Carolina, and five radio stations in Florida. Chesapeake-Portsmouth Broadcasting Corporation (“Chesapeake-Portsmouth”) is a company controlled by Nancy Epperson, wife of Salem’s Chairman of the Board Stuart W. Epperson and sister of CEO Edward G. Atsinger III. Chesapeake-Portsmouth owns and operates radio stations WJGR-AM, Jacksonville, Florida, WZNZ-AM, Jacksonville, Florida and WZAZ-AM, Jacksonville, Florida.
The markets where these radio stations are located are not currently served by stations owned and operated by the company. Under his employment agreement, Mr. Epperson is required to offer the company a right of first refusal of opportunities related to the company’s business.
Radio Stations Owned by Mr. Hinz
Mr. Hinz, a director of the company, through companies or entities controlled by him, operates three radio stations in Southern California. These radio stations are formatted in Christian Teaching and Talk programming in the Spanish language.
Truth For Life—Mr. Riddle
Truth For Life is a non-profit organization that is a customer of Salem Media Group, Inc. During 2017, 2016 and 2015, the company billed Truth For Life approximately $2.1 million, $2.2 million and $2.2 million, respectively, for airtime on its stations. The company had receivable balances of $0.2 million related to these sales at December 31, 2017 and 2016. Mr. Riddle, a director of the company, joined the Truth for Life board in October 2010 and remains a member of this board.
| 135 |
Know the Truth - Mr. Riddle
Know the Truth is a non-profit organization that is a customer of Salem Media Group, Inc. During 2017, 2016 and 2015, the company billed Know the Truth approximately $1.2 million, $0.4 million, and $0.4 million, respectively, for airtime on its stations. The company had receivable balances of $0.7 million and $0.2 million related to these sales at December 31, 2017 and 2016, respectively. Mr. Riddle, a director of the company, joined the Know the Truth board in 2010 and remains a member of this board.
The Truth Network – Stuart W. Epperson Jr.
The Truth Network provides original and broadcast Christian radio that is a customer of Salem Media Group, Inc. During 2017 and 2016, the company billed The Truth Network approximately $11,000, respectively, for airtime on its stations. The company had receivable balances of approximately $3,000 and $4,000 related to these sales at December 31, 2017 and 2016, respectively. Mr. Epperson Jr. is the CEO and President of the company.
Split-Dollar Life Insurance
Salem has maintained split-dollar life insurance policies for its Chairman and Chief Executive Officer since 1997. Since 2003, the company has been the owner of the split-dollar life insurance policies and is entitled to recover all of the premiums paid on these policies. The company records an asset based on the lower of the aggregate premiums paid or the insurance cash surrender value. The premiums were $386,000 for each of the years ended December 31, 2017, 2016 and 2015. As of December 31, 2017, 2016, and 2015, the company recorded the net cash surrender value of these policies as assets of $1.4 million, $1.0 million and $0.6 million, respectively. The cumulative premiums paid on these policies were $2.8 million, $2.6 million and $2.5 million, respectively. Benefits above and beyond the cumulative premiums paid will go to the beneficiary trusts established by each of the Chairman and Chief Executive Officer.
Transportation Services Supplied by Atsinger Aviation
From time to time, the company rents aircraft from a company owned by Edward G. Atsinger III, Chief Executive Officer and director of Salem. As approved by the independent members of the company’s board of directors, the company rents these aircraft on an hourly basis at what the company believes are market rates and uses them for general corporate needs. Total rental expense for these aircraft for 2017, 2016 and 2015 amounted to approximately $217,000, $301,000 and $133,000, respectively.
NOTE 17. DEFINED CONTRIBUTION PLAN
We maintain a 401(k) defined contribution plan (the “401(k) Plan”), which covers all eligible employees (as defined in the 401(k) Plan). Participants are allowed to make non-forfeitable contributions up to 60% of their annual salary, but may not exceed the annual maximum contribution limitations established by the Internal Revenue Service. The company match is currently 50% on the first 5% of the amounts contributed by each participant. During the years ended December 31, 2017, 2016 and 2015, the company contributed and expensed $1.9 million into the 401(k) Plan.
NOTE 18. EQUITY TRANSACTIONS
We account for stock-based compensation expense in accordance with FASB ASC Topic 718, Compensation-Stock Compensation. As a result, $1.7 million, $0.6 million and $0.8 million of non-cash stock-based compensation expense has been recorded to additional paid-in capital for the years ended December 31, 2017, 2016 and 2015, respectively.
While we intend to pay regular quarterly distributions, the actual declaration of such future distributions and the establishment of the per share amount, record dates, and payment dates are subject to final determination by our Board of Directors and dependent upon future earnings, cash flows, financial and legal requirements, and other factors. Any future distributions are likely to be comparable to prior declarations unless there are changes in expected future earnings, cash flows, financial and legal requirements.
The following table shows distributions that have been declared and paid since January 1, 2016:
| Announcement Date | Payment Date | Amount Per Share | Cash Distributed (in thousands) | |||||||
| December 7, 2017 | December 29, 2017 | $ | 0.0650 | $ | 1,701 | |||||
| September 12, 2017 | September 29, 2017 | $ | 0.0650 | $ | 1,701 | |||||
| June 1, 2017 | June 30, 2017 | $ | 0.0650 | $ | 1,697 | |||||
| March 9, 2017 | March 31, 2017 | $ | 0.0650 | $ | 1,691 | |||||
| December 7, 2016 | December 31, 2016 | $ | 0.0650 | $ | 1,678 | |||||
| September 9, 2016 | September 30, 2016 | $ | 0.0650 | $ | 1,679 | |||||
| June 2, 2016 | June 30, 2016 | $ | 0.0650 | $ | 1,664 | |||||
| March 10, 2016 | April 5, 2016 | $ | 0.0650 | $ | 1,657 | |||||
| 136 |
Based on the number of shares of Class A and Class B currently outstanding, we expect to pay total annual distributions of approximately $6.8 million for the year ended December 31, 2018.
NOTE 19. QUARTERLY RESULTS OF OPERATIONS (UNAUDITED):
The following table sets forth selected financial results of the company on a quarterly basis.
| March 31 | June 30 | September 30 | December 31 | |||||||||||||||||||||||||||||
| 2016 | 2017 | 2016 | 2017 | 2016 | 2017 | 2016 | 2017 | |||||||||||||||||||||||||
| (Dollars in thousands, except per share data) | ||||||||||||||||||||||||||||||||
| Total revenue | $ | 64,575 | $ | 64,980 | $ | 67,779 | $ | 66,112 | $ | 71,272 | $ | 65,433 | $ | 70,695 | $ | 67,211 | ||||||||||||||||
| Operating income | 6,083 | 4,819 | 9,702 | 8,619 | 8,835 | 5,005 | 3,458 | 4,531 | ||||||||||||||||||||||||
| Net income (loss) | $ | 353 | $ | 1,060 | $ | 3,356 | $ | 1,272 | $ | 2,192 | $ | (46 | ) | $ | 2,972 | $ | 22,358 | |||||||||||||||
| Basic earnings per share Class A and Class B common stock | $ | 0.01 | $ | 0.04 | $ | 0.13 | $ | 0.05 | $ | 0.08 | $ | — | $ | 0.11 | $ | 0.85 | ||||||||||||||||
| Diluted earnings per share Class A and B Class common stock | $ | 0.01 | $ | 0.04 | $ | 0.13 | $ | 0.05 | $ | 0.08 | $ | — | $ | 0.11 | $ | 0.85 | ||||||||||||||||
| Weighted average Class A and Class B shares outstanding – basic | 25,485,234 | 25,901,801 | 25,551,445 | 26,062,403 | 25,815,242 | 26,144,796 | 25,826,230 | 26,166,769 | ||||||||||||||||||||||||
| Weighted average Class A and Class B shares outstanding – diluted | 25,802,958 | 26,290,926 | 26,052,649 | 26,593,366 | 26,183,182 | 26,144,796 | 26,101,172 | 26,378,260 | ||||||||||||||||||||||||
NOTE 20. SEGMENT DATA
FASB ASC Topic 280, Segment Reporting, requires companies to provide certain information about their operating segments. We have three operating segments: (1) Broadcast, (2) Digital Media and (3) Publishing.
Our operating segments reflect how our chief operating decision makers, which we define as a collective group of senior executives, assess the performance of each operating segment and determine the appropriate allocations of resources to each segment. We continue to review our operating segment classifications to align with operational changes in our business and may make future changes as necessary.
We measure and evaluate our operating segments based on operating income and operating expenses that do not include allocations of costs related to corporate functions, such as accounting and finance, human resources, legal, tax and treasury; nor do they include costs such as amortization, depreciation, taxes or interest expense. Changes to our operating segments did not impact the reporting units used to test non-amortizable assets for impairment. All prior periods presented are updated to reflect the new composition of our operating segments. Segment performance, as defined by Salem, is not necessarily comparable to other similarly titled captions of other companies.
The table below presents financial information for each operating segment as of December 31, 2017, 2016 and 2015 based on the new composition of our operating segments:
| 137 |
| Broadcast | Digital Media | Publishing | Unallocated Corporate | Consolidated | ||||||||||||||||
| (Dollars in thousands) | ||||||||||||||||||||
| Year Ended December 31, 2017 | ||||||||||||||||||||
| Net revenue | $ | 196,197 | $ | 43,096 | $ | 24,443 | $ | — | $ | 263,736 | ||||||||||
| Operating expenses | 145,494 | 33,675 | 24,475 | 16,255 | 219,899 | |||||||||||||||
| Net operating income (loss) before depreciation, amortization, impairments, change in estimated fair value of contingent earn-out consideration and (gain) loss on the sale or disposal of assets | $ | 50,703 | $ | 9,421 | $ | (32 | ) | $ | (16,255 | ) | $ | 43,837 | ||||||||
| Depreciation | 7,754 | 3,166 | 644 | 805 | 12,369 | |||||||||||||||
| Amortization | 56 | 3,414 | 1,121 | 2 | 4,593 | |||||||||||||||
| Impairment of indefinite-lived long-term assets other than goodwill | — | — | 19 | — | 19 | |||||||||||||||
| Change in estimated fair value of contingent earn-out consideration | — | (23 | ) | — | — | (23 | ) | |||||||||||||
| (Gain) loss on the sale or disposal of assets | 3,898 | — | (5 | ) | 12 | 3,905 | ||||||||||||||
| Operating income (loss) | $ | 38,995 | $ | 2,864 | $ | (1,811 | ) | $ | (17,074 | ) | $ | 22,974 | ||||||||
| Year Ended December 31, 2016 | ||||||||||||||||||||
| Net revenue | $ | 202,016 | $ | 46,777 | $ | 25,528 | $ | — | $ | 274,321 | ||||||||||
| Operating expenses | 146,283 | 36,290 | 26,209 | 14,994 | 223,776 | |||||||||||||||
| Net operating income (loss) before depreciation, amortization, impairments, change in estimated fair value of contingent earn-out consideration and (gain) loss on the sale or disposal of assets | $ | 55,733 | $ | 10,487 | $ | (681 | ) | $ | (14,994 | ) | $ | 50,545 | ||||||||
| Depreciation | 7,592 | 3,092 | 675 | 846 | 12,205 | |||||||||||||||
| Amortization | 86 | 4,304 | 680 | 1 | 5,071 | |||||||||||||||
| Impairment of long-lived assets | 700 | — | — | — | 700 | |||||||||||||||
| Impairment of indefinite-lived long-term assets other than goodwill | 6,540 | — | 501 | — | 7,041 | |||||||||||||||
| Impairment of goodwill | — | 32 | — | — | 32 | |||||||||||||||
| Impairment of amortizable intangible assets | — | 8 | — | — | 8 | |||||||||||||||
| Change in estimated fair value of contingent earn-out consideration | — | (146 | ) | (543 | ) | — | (689 | ) | ||||||||||||
| (Gain) loss on the sale or disposal of assets | (2,122 | ) | 236 | (21 | ) | 6 | (1,901 | ) | ||||||||||||
| Operating income (loss) | $ | 42,937 | $ | 2,961 | $ | (1,973 | ) | $ | (15,847 | ) | $ | 28,078 | ||||||||
| Year Ended December 31, 2015 | ||||||||||||||||||||
| Net revenue | $ | 197,184 | $ | 44,761 | $ | 23,842 | $ | — | $ | 265,787 | ||||||||||
| Operating expenses | 140,819 | 35,380 | 24,774 | 15,146 | 216,119 | |||||||||||||||
| Net operating income (loss) before depreciation, amortization, impairments, change in estimated fair value of contingent earn-out consideration and (gain) loss on the sale or disposal of assets | $ | 56,365 | $ | 9,381 | $ | (932 | ) | $ | (15,146 | ) | $ | 49,668 | ||||||||
| Depreciation | 7,726 | 3,091 | 637 | 963 | 12,417 | |||||||||||||||
| Amortization | 96 | 4,685 | 542 | 1 | 5,324 | |||||||||||||||
| Impairment of goodwill | 439 | — | — | — | 439 | |||||||||||||||
| Change in estimated fair value of contingent earn-out consideration | — | (478 | ) | (1,237 | ) | — | (1,715 | ) | ||||||||||||
| (Gain) loss on the sale or disposal of assets | 219 | 11 | (58 | ) | 9 | 181 | ||||||||||||||
| Operating income (loss) | $ | 47,885 | $ | 2,072 | $ | (816 | ) | $ | (16,119 | ) | $ | 33,022 | ||||||||
| 138 |
| Broadcast | Digital Media | Publishing | Unallocated Corporate | Consolidated | ||||||||||||||||||
| (Dollars in thousands) | ||||||||||||||||||||||
| As of December 31, 2017 | ||||||||||||||||||||||
| Inventories, net | $ | — | $ | 313 | $ | 417 | $ | — | $730 | |||||||||||||
| Property and equipment, net | 83,901 | 6,173 | 1,281 | 8,125 | 99,480 | |||||||||||||||||
| Broadcast licenses | 380,914 | — | — | — | 380,914 | |||||||||||||||||
| Goodwill | 3,581 | 20,947 | 1,888 | 8 | 26,424 | |||||||||||||||||
| Other indefinite-lived intangible assets | — | — | 313 | — | 313 | |||||||||||||||||
| Amortizable intangible assets, net | 351 | 9,801 | 2,947 | 5 | 13,104 | |||||||||||||||||
| As of December 31, 2016 | ||||||||||||||||||||||
| Inventories, net | $ | — | $ | 300 | $ | 370 | $ | — | $670 | |||||||||||||
| Property and equipment, net | 86,976 | 6,634 | 1,779 | 7,401 | 102,790 | |||||||||||||||||
| Broadcast licenses | 388,517 | — | — | — | 388,517 | |||||||||||||||||
| Goodwill | 3,581 | 20,136 | 1,888 | 8 | 25,613 | |||||||||||||||||
| Other indefinite-lived intangible assets | — | — | 332 | — | 332 | |||||||||||||||||
| Amortizable intangible assets, net | 407 | 9,927 | 4,069 | 5 | 14,408 | |||||||||||||||||
NOTE 21. SUBSEQUENT EVENTS
On January 3, 2018, we entered an agreement to sell radio station WBIX-AM in Boston, Massachusetts for $0.7 million in cash. The sale is expected to close later in 2018.
On February 28, 2018, we announced a quarterly equity distribution in the amount of $0.0650 per share on Class A and Class B common stock. The equity distribution will be paid on March 28, 2018 to all Class A and Class B common stockholders of record as of March 14, 2018.
On March 1, 2018, we entered an APA to acquire radio station KZTS-FM in Little Rock, Arkansas for $1.1 million in cash. We will begin programming the station under an LMA on April 1, 2018. The sale is expected to close in June 2018.
Subsequent events reflect all applicable transactions through the date of the filing.
ITEM 9. CHANGES IN AND DISAGREEMENTS WITH ACCOUNTANTS ON ACCOUNTING AND FINANCIAL DISCLOSURE.
None.
ITEM 9A. CONTROLS AND PROCEDURES.
(a) Evaluation of Disclosure Controls and Procedures.
We maintain disclosure controls and procedures that are designed to ensure that information required to be disclosed in our Exchange Act reports is recorded, processed, summarized and reported within the time periods specified in the SEC’s rules and forms, and that such information is accumulated and communicated to our management, including our Chief Executive Officer and Chief Financial Officer, as appropriate, to allow for timely decisions regarding required disclosure. In designing and evaluating the disclosure controls and procedures, management recognized that any controls and procedures, no matter how well designed and operated, can provide only reasonable assurance of achieving the desired control objectives, and, management necessarily was required to apply its judgment in evaluating the cost-benefit relationship of possible controls and procedures.
| 139 |
As required by Rule 13a-15(b) of the Exchange Act, we carried out an evaluation, under the supervision and with the participation of our management, including our Chief Executive Officer and Chief Financial Officer, of the effectiveness of the design and operation of our disclosure controls and procedures (as defined by Exchange Act Rule 13a-15(e)). Based upon the foregoing, our Chief Executive Officer and Chief Financial Officer concluded that the Company’s disclosure controls and procedures were effective at the reasonable assurance level as of December 31, 2017, the end of the period covered by this report.
(b) Management’s Annual Report on Internal Control Over Financial Reporting
Internal control over financial reporting refers to the process designed by, or under the supervision of, our Chief Executive Officer and Chief Financial Officer, and effected by our board of directors, management and other personnel, to provide reasonable assurance regarding the reliability of financial reporting and the preparation of financial statements for external purposes in accordance with generally accepted accounting principles, and includes those policies and procedures that:
| (1) | Pertain to the maintenance of records that in reasonable detail accurately and fairly reflect the transactions and dispositions of the assets of the Company; |
| (2) | Provide reasonable assurance that transactions are recorded as necessary to permit preparation of financial statements in accordance with generally accepted accounting principles, and that receipts and expenditures of the Company are being made only in accordance with authorizations of managements and directors of the Company; and |
| (3) | Provide reasonable assurance regarding prevention or timely detection of unauthorized acquisition, use or disposition of the Company’s assets that could have a material effect on the financial statements. |
Internal control over financial reporting cannot provide absolute assurance of achieving financial reporting objectives because of its inherent limitations. Internal control over financial reporting is a process that involves human diligence and compliance and is subject to lapses in judgment and breakdowns resulting from human failures. Internal control over financial reporting also can be circumvented by collusion or improper management override. Because of such limitations, there is a risk that material misstatements may not be prevented or detected on a timely basis by internal control over financial reporting. However, these inherent limitations are known features of the financial reporting process. Therefore, it is possible to design into the process safeguards to reduce, though not eliminate, this risk.
Management is responsible for establishing and maintaining adequate internal control over financial reporting for the Company. Management has used the framework set forth in the 2013 report entitled “Internal Control - Integrated Framework” published by the Committee of Sponsoring Organizations (“COSO”) of the Treadway Commission to evaluate the effectiveness of the Company’s internal control over financial reporting. Management has concluded that the Company’s internal control over financial reporting was effective as of the end of the most recent fiscal year.
(c) Attestation Report of Registered Public Accounting Firm. The effectiveness of our internal control over financial reporting as of December 31, 2017 has been audited by Crowe Horwath LLP, an independent registered public accounting firm, as stated in their report which is included herein.
(d) Changes in Internal Control Over Financial Reporting. .. There has been no change in our internal control over financial reporting during the Company’s fourth fiscal quarter of 2017 that has materially affected, or is reasonably likely to materially affect, the Company’s internal control over financial reporting...
| 140 |
Report of Independent Registered Public Accounting Firm
Stockholders and the Board of Directors of
Salem Media Group, Inc.
Camarillo, California
Opinion on Internal Control over Financial Reporting
We have audited Salem Media Group, Inc.’s (the “Company”) internal control over financial reporting as of December 31, 2017, based on criteria established in Internal Control – Integrated Framework: (2013) issued by the Committee of Sponsoring Organizations of the Treadway Commission (COSO). In our opinion, the Company maintained, in all material respects, effective internal control over financial reporting as of December 31, 2017, based on criteria established in Internal Control – Integrated Framework: (2013) issued by COSO.
We also have audited, in accordance with the standards of the Public Company Accounting Oversight Board (United States) (“PCAOB”), the consolidated balance sheets of the Company as of December 31, 2017 and 2016, the related consolidated statements of operations, stockholders’ equity, and cash flows for the years then ended, and the related notes and financial statement schedule listed in Item 15(a) (collectively referred to as the "financial statements") and our report dated March 15, 2018 expressed an unqualified opinion.
Basis for Opinion
The Company’s management is responsible for maintaining effective internal control over financial reporting and for its assessment of the effectiveness of internal control over financial reporting, included in the accompanying Management’s Annual Report on Internal Control over Financial Reporting. Our responsibility is to express an opinion on the Company’s internal control over financial reporting based on our audit. We are a public accounting firm registered with the PCAOB and are required to be independent with respect to the Company in accordance with the U.S. federal securities laws and the applicable rules and regulations of the Securities and Exchange Commission and the PCAOB.
We conducted our audit in accordance with the standards of the PCAOB. Those standards require that we plan and perform the audit to obtain reasonable assurance about whether effective internal control over financial reporting was maintained in all material respects. Our audit of internal control over financial reporting included obtaining an understanding of internal control over financial reporting, assessing the risk that a material weakness exists, and testing and evaluating the design and operating effectiveness of internal control based on the assessed risk. Our audit also included performing such other procedures as we considered necessary in the circumstances. We believe that our audit provides a reasonable basis for our opinion.
Definition and Limitations of Internal Control Over Financial Reporting
A company’s internal control over financial reporting is a process designed to provide reasonable assurance regarding the reliability of financial reporting and the preparation of financial statements for external purposes in accordance with generally accepted accounting principles. A company’s internal control over financial reporting includes those policies and procedures that (1) pertain to the maintenance of records that, in reasonable detail, accurately and fairly reflect the transactions and dispositions of the assets of the company; (2) provide reasonable assurance that transactions are recorded as necessary to permit preparation of financial statements in accordance with generally accepted accounting principles, and that receipts and expenditures of the company are being made only in accordance with authorizations of management and directors of the company; and (3) provide reasonable assurance regarding prevention or timely detection of unauthorized acquisition, use, or disposition of the company’s assets that could have a material effect on the financial statements.
Because of its inherent limitations, internal control over financial reporting may not prevent or detect misstatements. Also, projections of any evaluation of effectiveness to future periods are subject to the risk that controls may become inadequate because of changes in conditions, or that the degree of compliance with the policies or procedures may deteriorate.
| Crowe Horwath LLP | |
| Sherman Oaks, California | |
| March 15, 2018 |
| 141 |
Not applicable.
ITEM 10. DIRECTORS, EXECUTIVE OFFICERS AND CORPORATE GOVERNANCE.
The information required by this item is incorporated by reference to our Definitive Proxy Statement under the heading “DIRECTORS AND EXECUTIVE OFFICERS OF THE REGISTRANT,” expected to be filed within 120 days of our fiscal year end.
ITEM 11. EXECUTIVE COMPENSATION.
The information required by this item is incorporated by reference to our Definitive Proxy Statement under the heading “EXECUTIVE COMPENSATION,” expected to be filed within 120 days of our fiscal year end.
ITEM 12. SECURITY OWNERSHIP OF CERTAIN BENEFICIAL OWNERS AND MANAGEMENT AND RELATED STOCKHOLDER MATTERS.
The information required by this item is incorporated by reference to our Definitive Proxy Statement under the heading “SECURITY OWNERSHIP OF CERTAIN BENEFICIAL OWNERS AND MANAGEMENT AND RELATED STOCKHOLDER MATTERS” expected to be filed within 120 days of our fiscal year end.
ITEM 13. CERTAIN RELATIONSHIPS AND RELATED TRANSACTIONS AND DIRECTOR INDEPENDENCE.
The information required by this item relating to “Certain Relationships and Related Party Transactions” is incorporated by reference to our Definitive Proxy Statement under the heading “CERTAIN RELATIONSHIPS AND RELATED TRANSACTIONS” expected to be filed within 120 days of our fiscal year end.
The information required by this item relating to “Director Independence” is incorporated by reference to our Definitive Proxy Statement under the heading “DIRECTOR INDEPENDENCE” expected to be filed within 120 days of our fiscal year end.
ITEM 14. PRINCIPAL ACCOUNTING FEES AND SERVICES.
The information required by this item is incorporated by reference to our Definitive Proxy Statement under the heading “PRINCIPAL ACCOUNTING FEES AND SERVICES,” expected to be filed within 120 days of our fiscal year end.
ITEM 15. EXHIBITS AND FINANCIAL STATEMENT SCHEDULES.
(a)
1. Financial Statements. The financial statements required to be filed hereunder are included in Item 8.
2. Financial Statement Schedule. The following financial statement schedule for the years ended December 31, 2017, 2016 and 2015 is filed as part of this report and should be read in conjunction with the Consolidated Financial Statements.
| 142 |
SALEM MEDIA GROUP, INC.
Schedule II – Valuation & Qualifying Accounts
(Dollars in thousands)
| Additions | ||||||||||||||||
| Balance at | Charged to | Deductions | ||||||||||||||
| Beginning of | Cost and | Bad Debt | Balance at | |||||||||||||
| Description | Period | Expense | Write-offs | End of Period | ||||||||||||
| Year Ended December 31, 2015 Allowance for Doubtful Accounts and Sales Returns | 12,727 | 8,325 | (7,573 | ) | 13,479 | |||||||||||
| Year Ended December 31, 2016 Allowance for Doubtful Accounts and Sales Returns | 13,479 | 5,369 | (8,428 | ) | 10,420 | |||||||||||
| Year Ended December 31, 2017 Allowance for Doubtful Accounts and Sales Returns | 10,420 | 7,760 | (7,161 | ) | 11,019 | |||||||||||
| Year Ended December 31, 2015 Allowance for Inventory Reserves | 1,227 | 628 | — | 1,855 | ||||||||||||
| Year Ended December 31, 2016 Allowance for Inventory Reserves | 1,855 | 406 | (35 | ) | 2,226 | |||||||||||
| Year Ended December 31, 2017 Allowance for Inventory Reserves | 2,226 | 95 | (664 | ) | 1,657 | |||||||||||
All other schedules for which provision is made in the applicable accounting regulation of the Securities and Exchange Commission are not required under the related instructions or are inapplicable, and therefore have been omitted.
3. Exhibits.
EXHIBIT LIST
| 143 |
| 144 |
| 145 |
| 146 |
| 147 |
| 148 |
| 149 |
| 150 |
| 151 |
| 31.1 | Certification of Edward G. Atsinger III Pursuant to Rules 13a-14(a) and 15d-14(a) under the Exchange Act. | - | - | - | - | X | ||||||
| 31.2 | Certification of Evan D. Masyr Pursuant to Rules 13a-14(a) and 15d-14(a) under the Exchange Act. | - | - | - | - | X | ||||||
| 32.1 | Certification of Edward G. Atsinger III Pursuant to 18 U.S.C. Section 1350. | - | - | - | - | X | ||||||
| 32.2 | Certification of Evan D. Masyr Pursuant to 18 U.S.C. Section 1350. | - | - | - | - | X | ||||||
| 101 | The following financial information from the Annual Report on Form 10-K for the fiscal year ended December 31, 2017, formatted in XBRL (Extensible Business Reporting Language) and furnished electronically herewith: (i) the Consolidated Balance Sheets (ii) Consolidated Statements of Operations (iii) the Consolidated Statement of Stockholders’ Equity (iv) the Consolidated Statements of Cash Flows (v) the Notes to the Consolidated Financial Statements. | - | - | - | - | X |
| 152 |
Pursuant to the requirements of Section 13 or 15(d) of the Securities Exchange Act of 1934, the registrant has duly caused this report to be signed on its behalf by the undersigned, thereunto duly authorized.
| SALEM MEDIA GROUP, INC. | |
| March 15, 2018 | |
| By: /s/ EDWARD G. ATSINGER III | |
| Edward G. Atsinger III | |
| Chief Executive Officer | |
| March 15, 2018 | |
| By: /s/ EVAN D. MASYR | |
| Evan D. Masyr | |
| Executive Vice President and Chief Financial Officer |
| 153 |
Pursuant to the requirements of the Securities Exchange Act of 1934, this report has been signed below by the following persons on behalf of the registrant and in the capacities and on the dates indicated.
| Signature | Title | Date | ||
| /s/ EDWARD G. ATSINGER III | Chief Executive Officer | |||
| Edward G. Atsinger III | (Principal Executive Officer) | March 15, 2018 | ||
| /s/ EVAN D. MASYR | Executive Vice President and Chief Financial Officer | |||
| Evan D. Masyr | (Principal Financial Officer and Principal Accounting Officer) | March 15, 2018 | ||
| /s/ STUART W. EPPERSON | Chairman | |||
| Stuart W. Epperson | March 15, 2018 | |||
| /s/ ROLAND S. HINZ | Director | |||
| Roland S. Hinz | March 15, 2018 | |||
| /s/ JONATHAN VENVERLOH | Director | |||
| Jonathan Venverloh | March 15, 2018 | |||
| /s/ RICHARD A. RIDDLE | Director | |||
| Richard A. Riddle | March 15, 2018 | |||
| /s/ JAMES KEET LEWIS | Director | |||
| James Keet Lewis | March 15, 2018 | |||
| /s/ ERIC HALVORSON | Director | |||
| Eric Halvorson | March 15, 2018 | |||
| /s/ EDWARD C. ATSINGER | Director | |||
| Edward C. Atsinger | March 15, 2018 | |||
| /s/ STUART W. EPPERSON JR. | Director | |||
| Stuart W. Epperson Jr. | March 15, 2018 |
| 154 |
| 155 |